Tariffs, geopolitics and rates shape investment appetites
High liquidity and strong balance sheets have not whetted corporate appetite for investment.

Despite high liquidity levels and strong balance sheets, companies are adopting a cautious approach towards investing amid geopolitical and economic uncertainty. However, our new report, Capital Structure & Rating Advisory Annual Insights 2025, highlights significant opportunities for these firms to deploy capital towards strategic investments and rewarding shareholders.
Based on our analysis of over 950 large publicly-listed corporations across 18 sectors globally, the report explores the key factors set to drive corporate spending in the coming year.
Dealing with a volatile geopolitical backdrop
Companies are navigating a volatile geopolitical landscape that may significantly shape financial strategies in an increasingly complex world. Three factors are becoming increasingly important.
The first is the impact of Treasury rates and their fluctuation. After major hikes and recent easing, central banks face an uncertain interest rate trajectory for 2025. This leaves them in a delicate balancing act between keeping inflation at bay and encouraging growth as political and economic uncertainty persist.
The second factor is the impact of potential import tariffs, especially between the US and China, which may complicate cross-border trade and profitability in various sectors.
Lastly, the evolving momentum of the ESG (Environment, Social and Governance) agenda, especially for so-called hard-to-abate sectors, adds another layer of complexity.
Eight of the 18 sectors analysed are likely to be affected by one or more of these factors, with some exposed to inherent volatility. Ensuring their financial strategies have sufficient headroom could be crucial in navigating the challenges ahead.
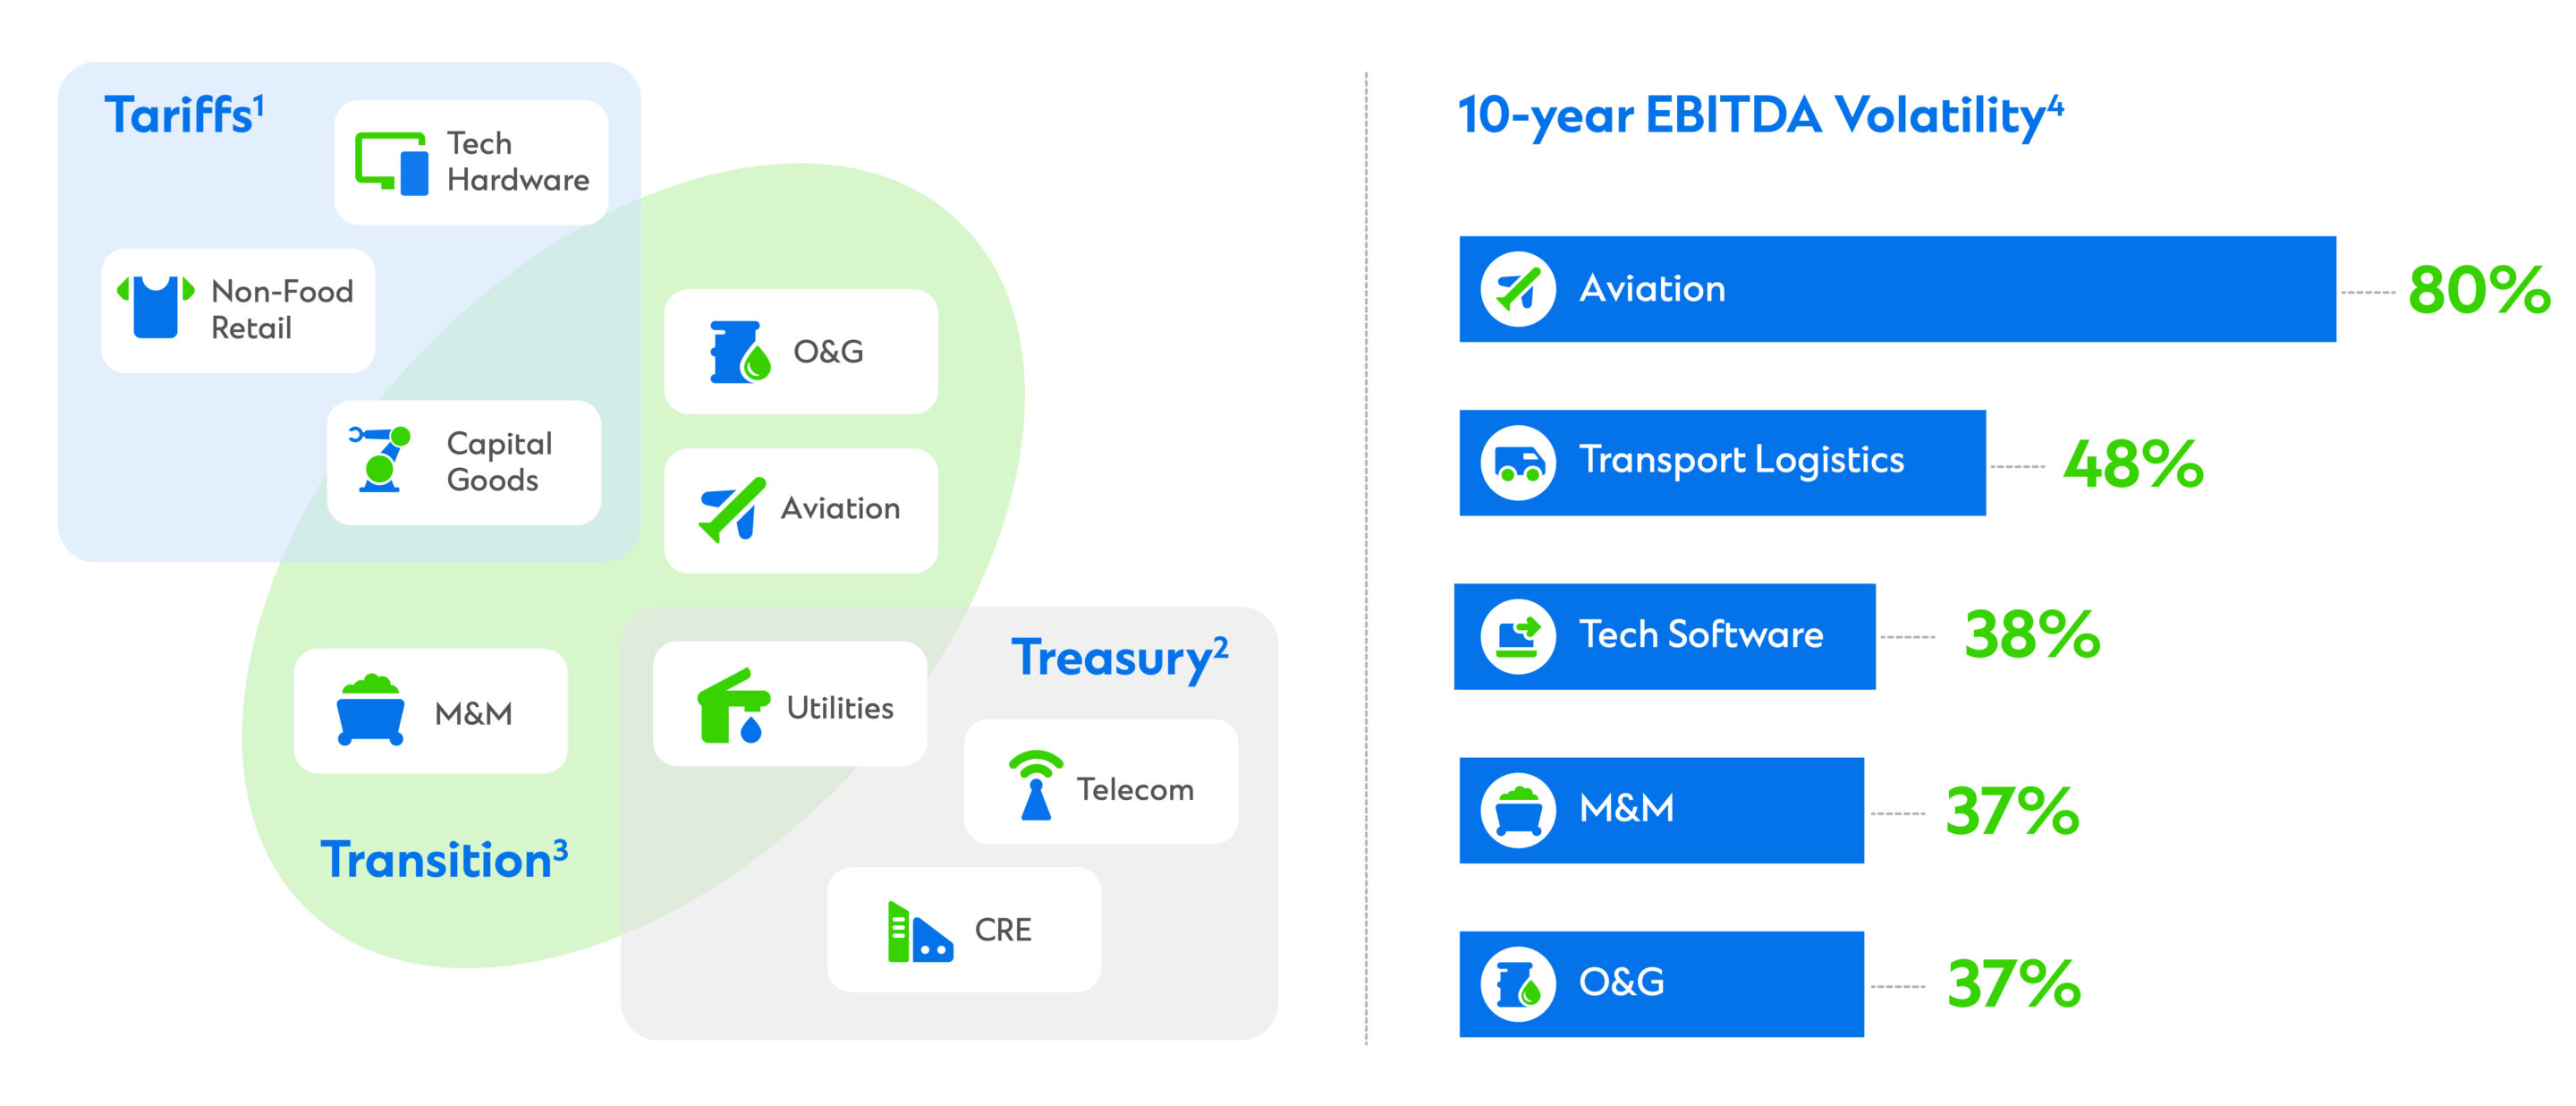
Notes: 1) Tariffs: escalating trade tariffs across geographies and related impact on corporate sectors; 2) Treasury: risk of the Trump administration’s policies leading to reflation and higher interest rate expectation; 3) Transition: the pace of ESG transition may have changed, but this remains a critical part of some sectors.
Shareholder returns rise but capital allocation remains conservative
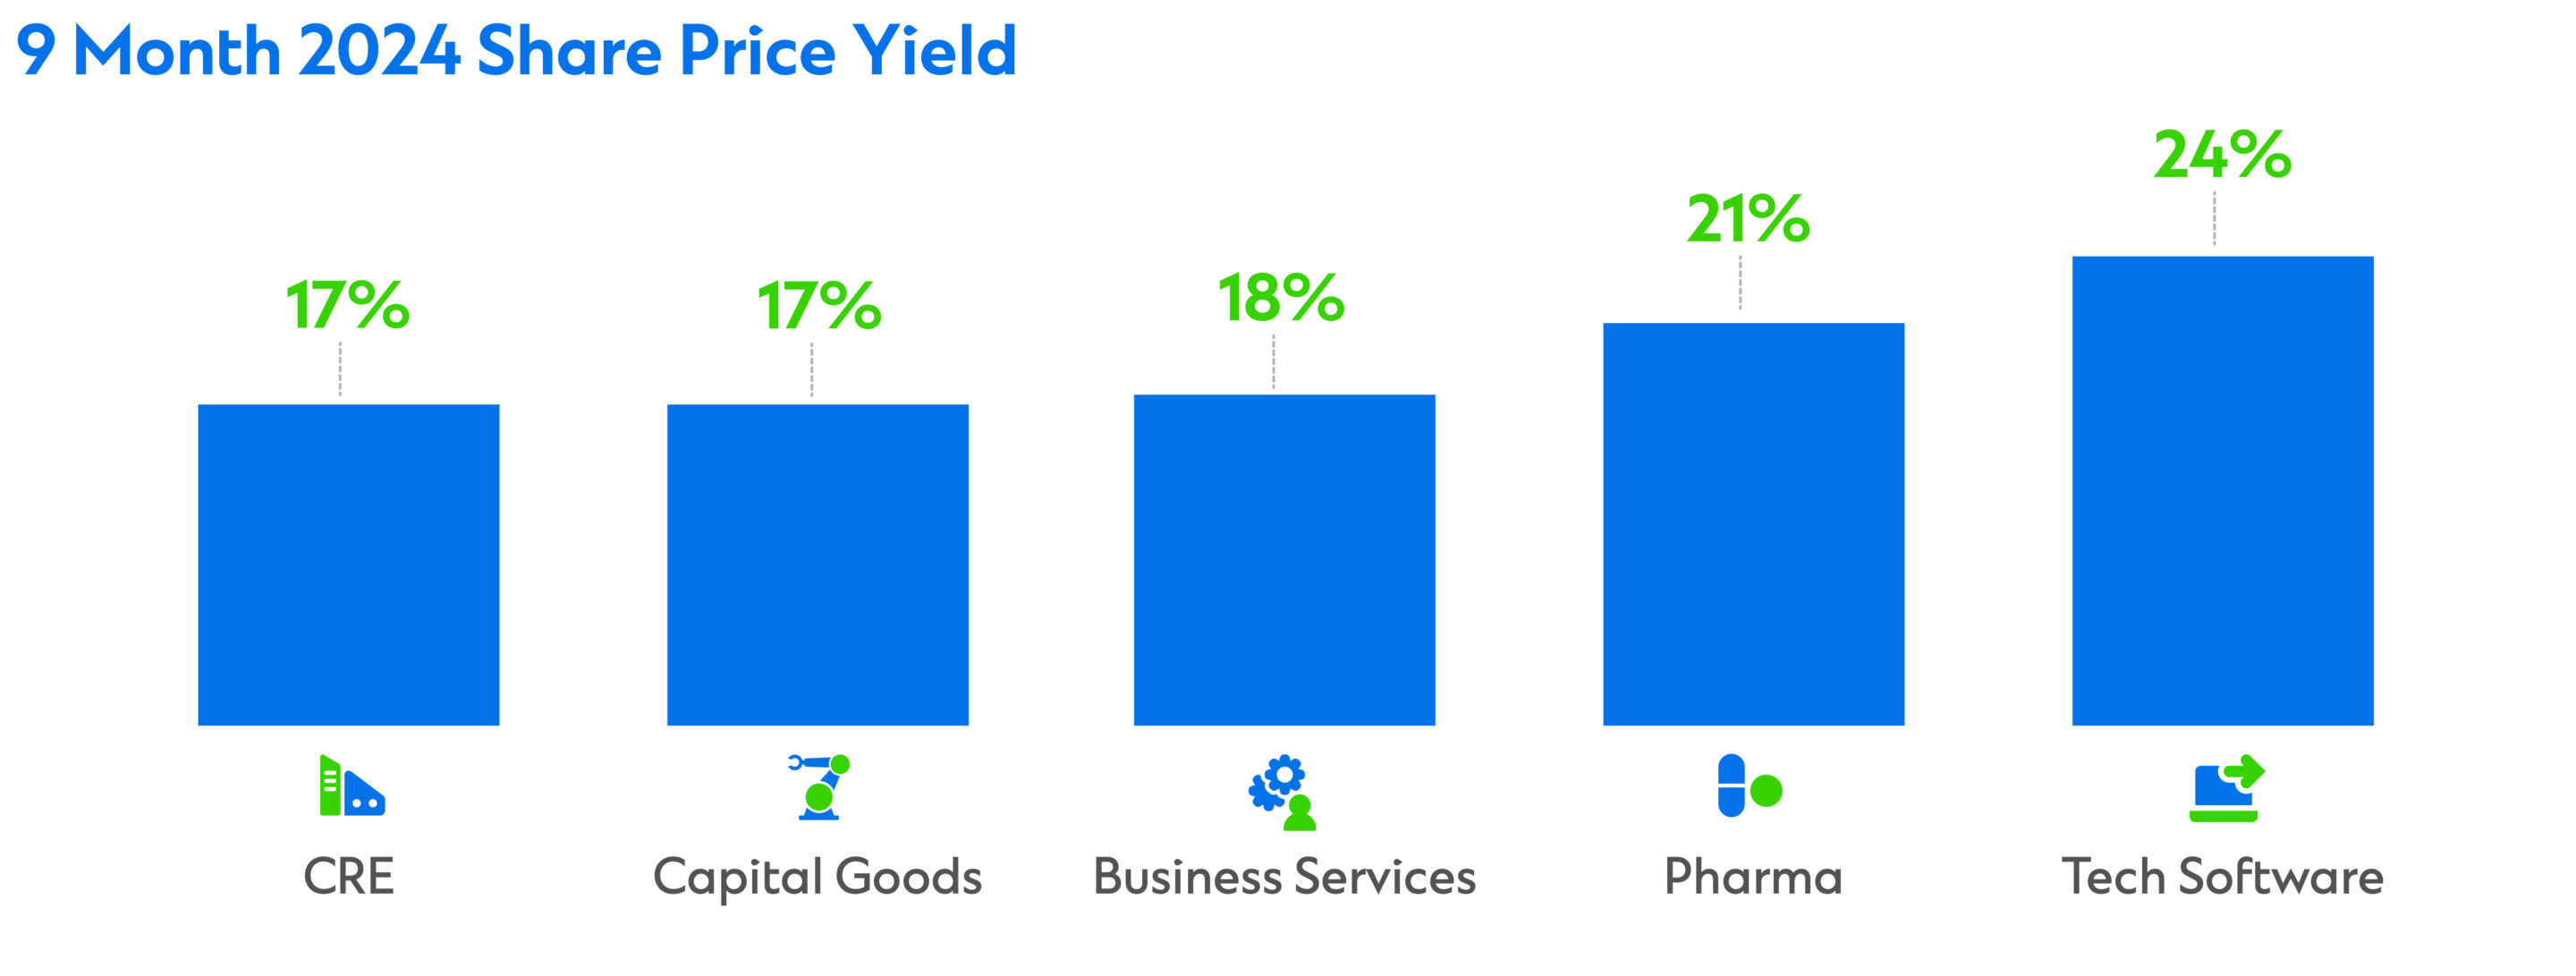
With equity markets at all-time highs last year, stronger earnings drove higher share price yields while valuation multiples stayed relatively stable.
Tech Software and Pharma had the highest share price yields, followed by Business Services, Capital Goods, and Commercial Real Estate (CRE).
However, this increase did not necessarily translate into proportionate growth in cash distribution yields from dividends or buybacks. These remained stable or dipped across most sectors, suggesting shareholder returns may not be keeping pace with company growth.
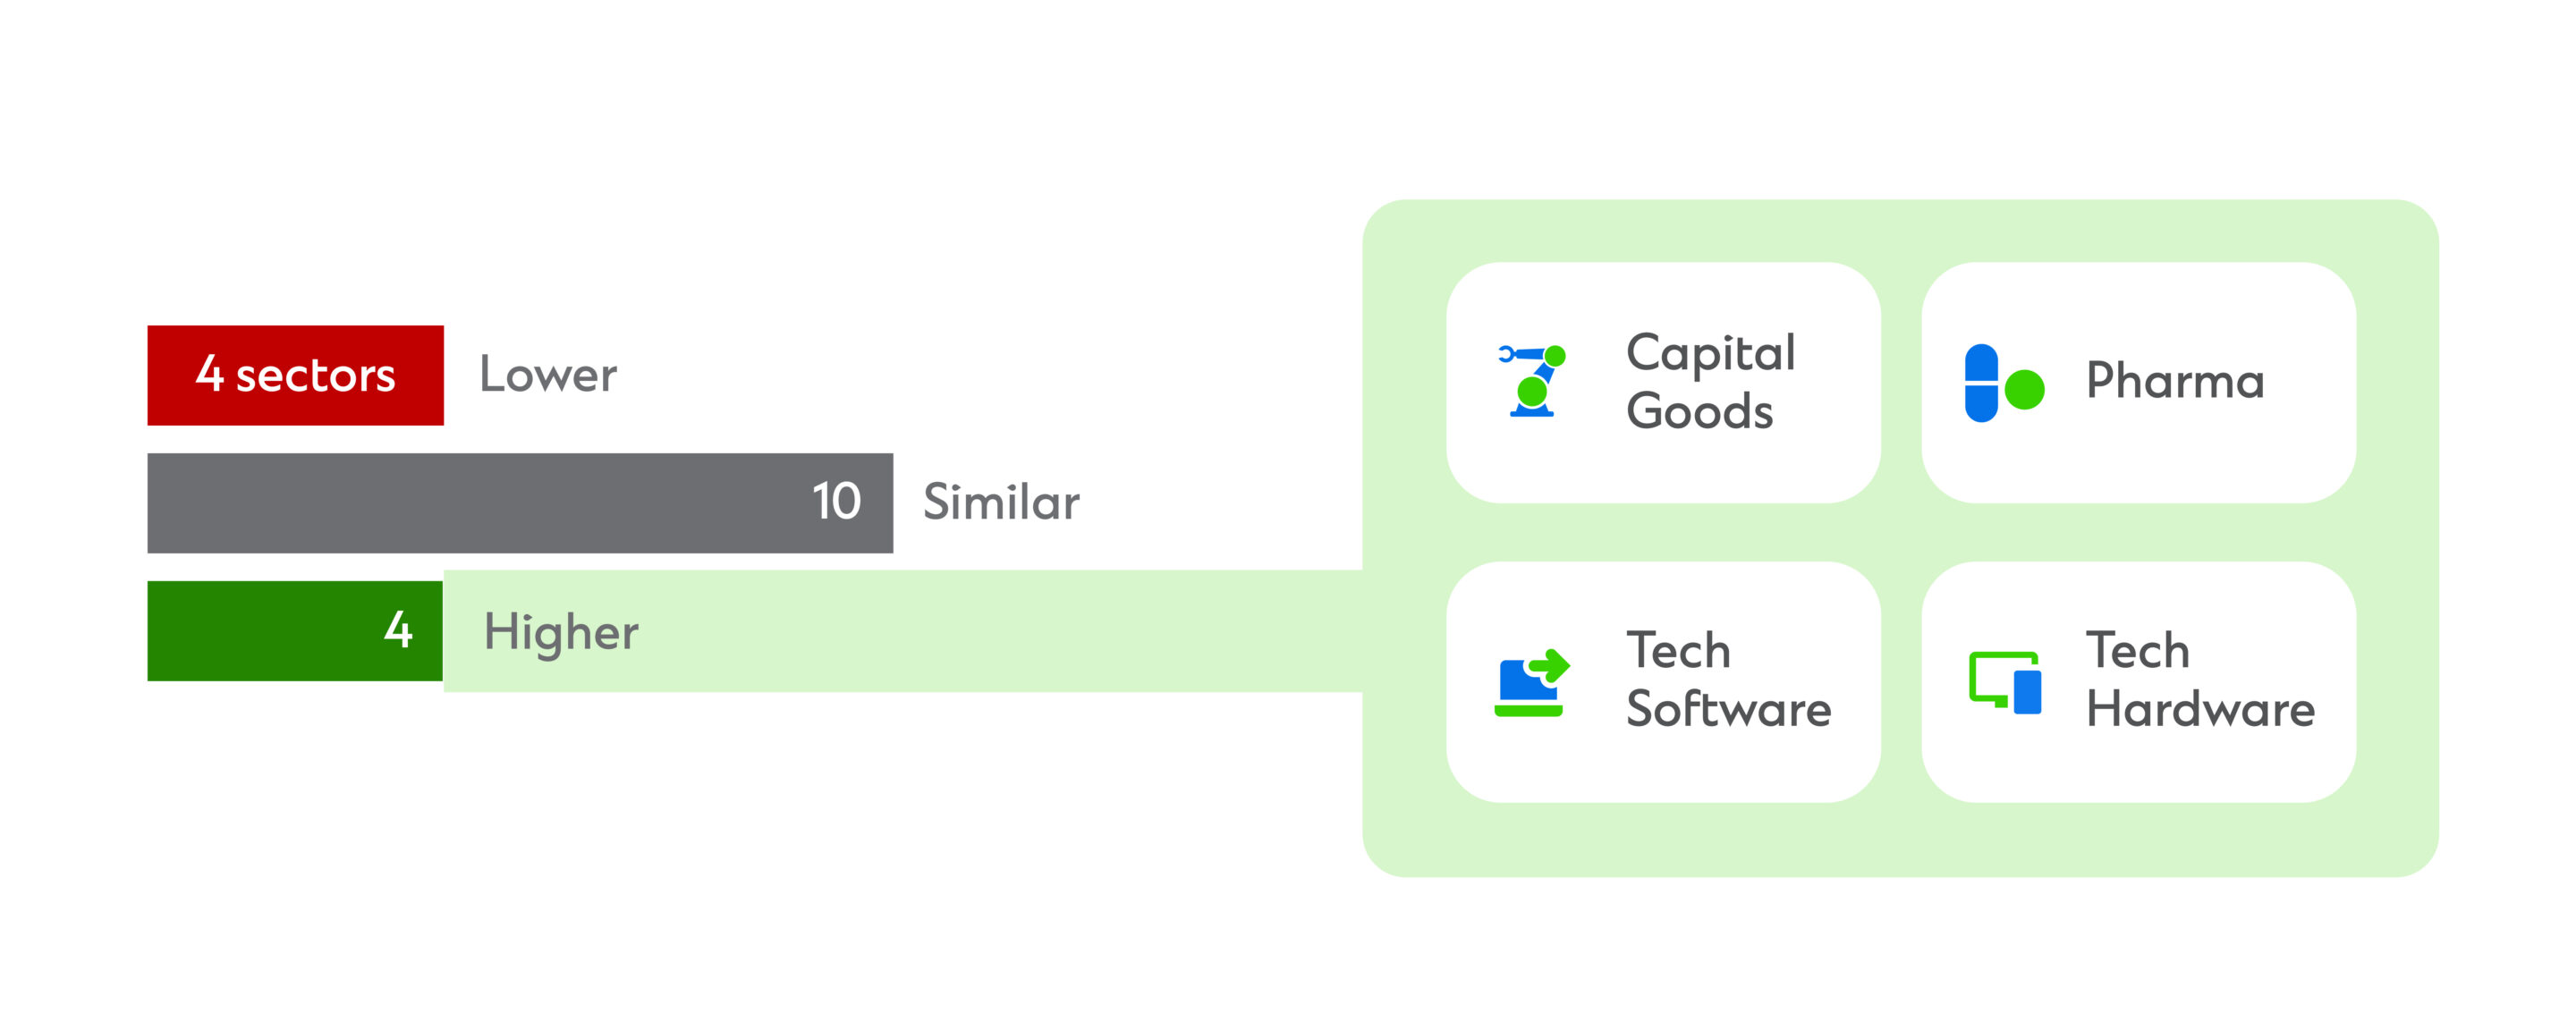
This caution was also apparent in M&A spending, which was broadly similar or lower for most sectors analysed.
Only Capital Goods, Pharma, Tech Software and Tech Hardware bucked the trend. Pharma stood out with the highest M&A spending of all 18 sectors.
Strong balance sheets leave untapped headroom for investment
Higher earnings also increased companies’ capacity to absorb more debt. While net debt for all sectors increased, leverage – net debt as a proportion of earnings (EBITDA) – remained stable or improved.
Sectors like Oil and Gas, Tech Hardware, Metals and Mining, Tech Software and Non-Food Retail led the charge with excess capacity exceeding 1x EBITDA.
Credit ratings have also largely remained steady, with average ratings in two sectors even improving and the risk of looming downgrades lower for many others.
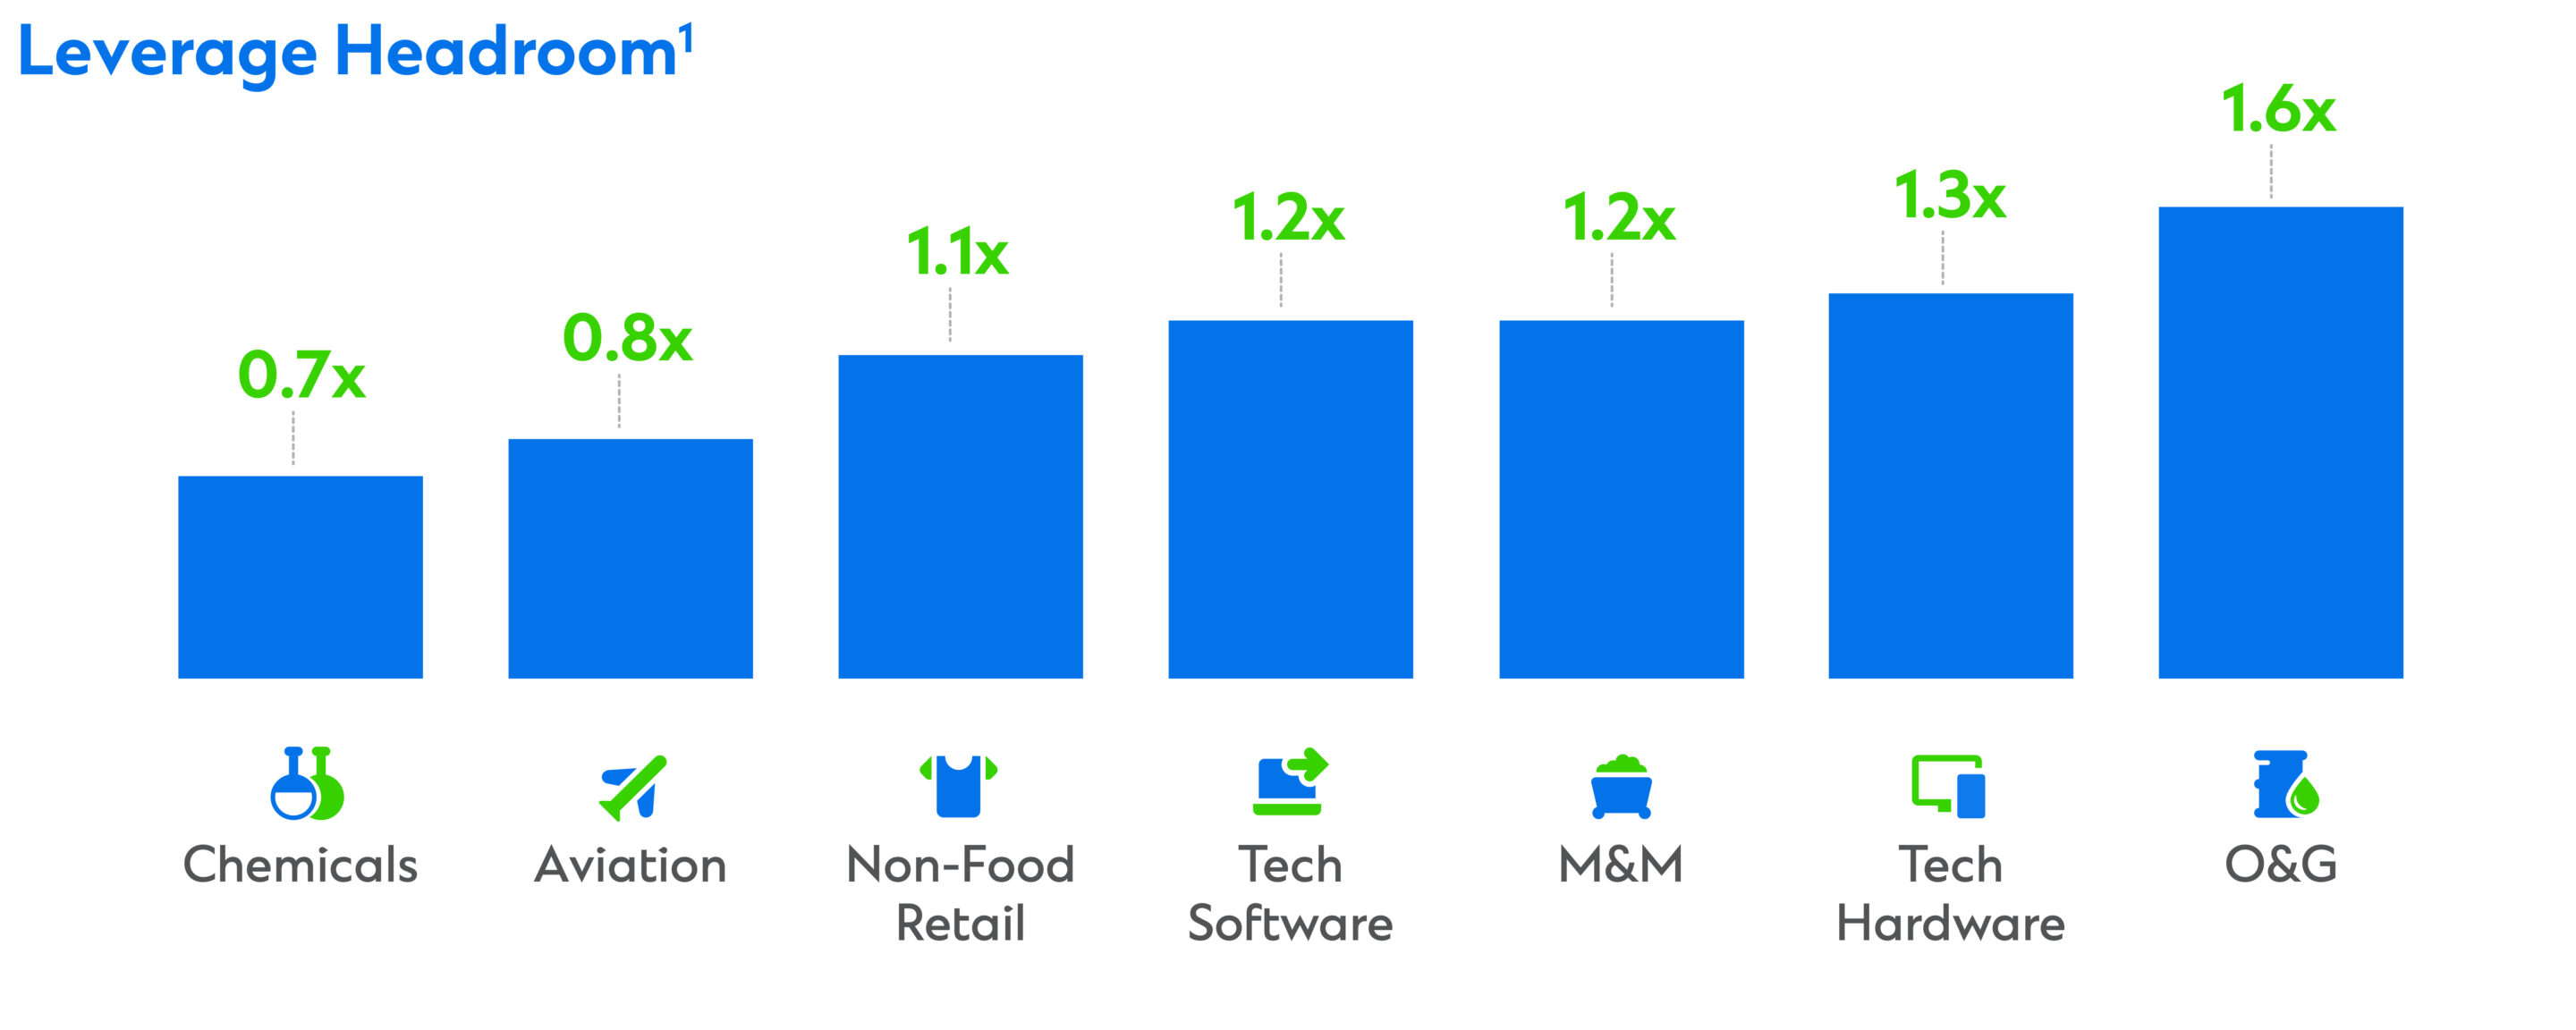
Note: (1) Headroom based on S&P average sector anchor rating and implied thresholds (mid-point) for Net Debt to EBITDA in line with S&P methodology, data on a cumulative basis.
Working capital cycles are down while excess liquidity persists
As a result, corporates expanded cash buffers further in 2024, now running 21 per cent higher than in 2019.
Pharma and Tech were the only exceptions as they capitalised on M&A opportunities to strategically cut excess cash and increase balance sheet efficiency.
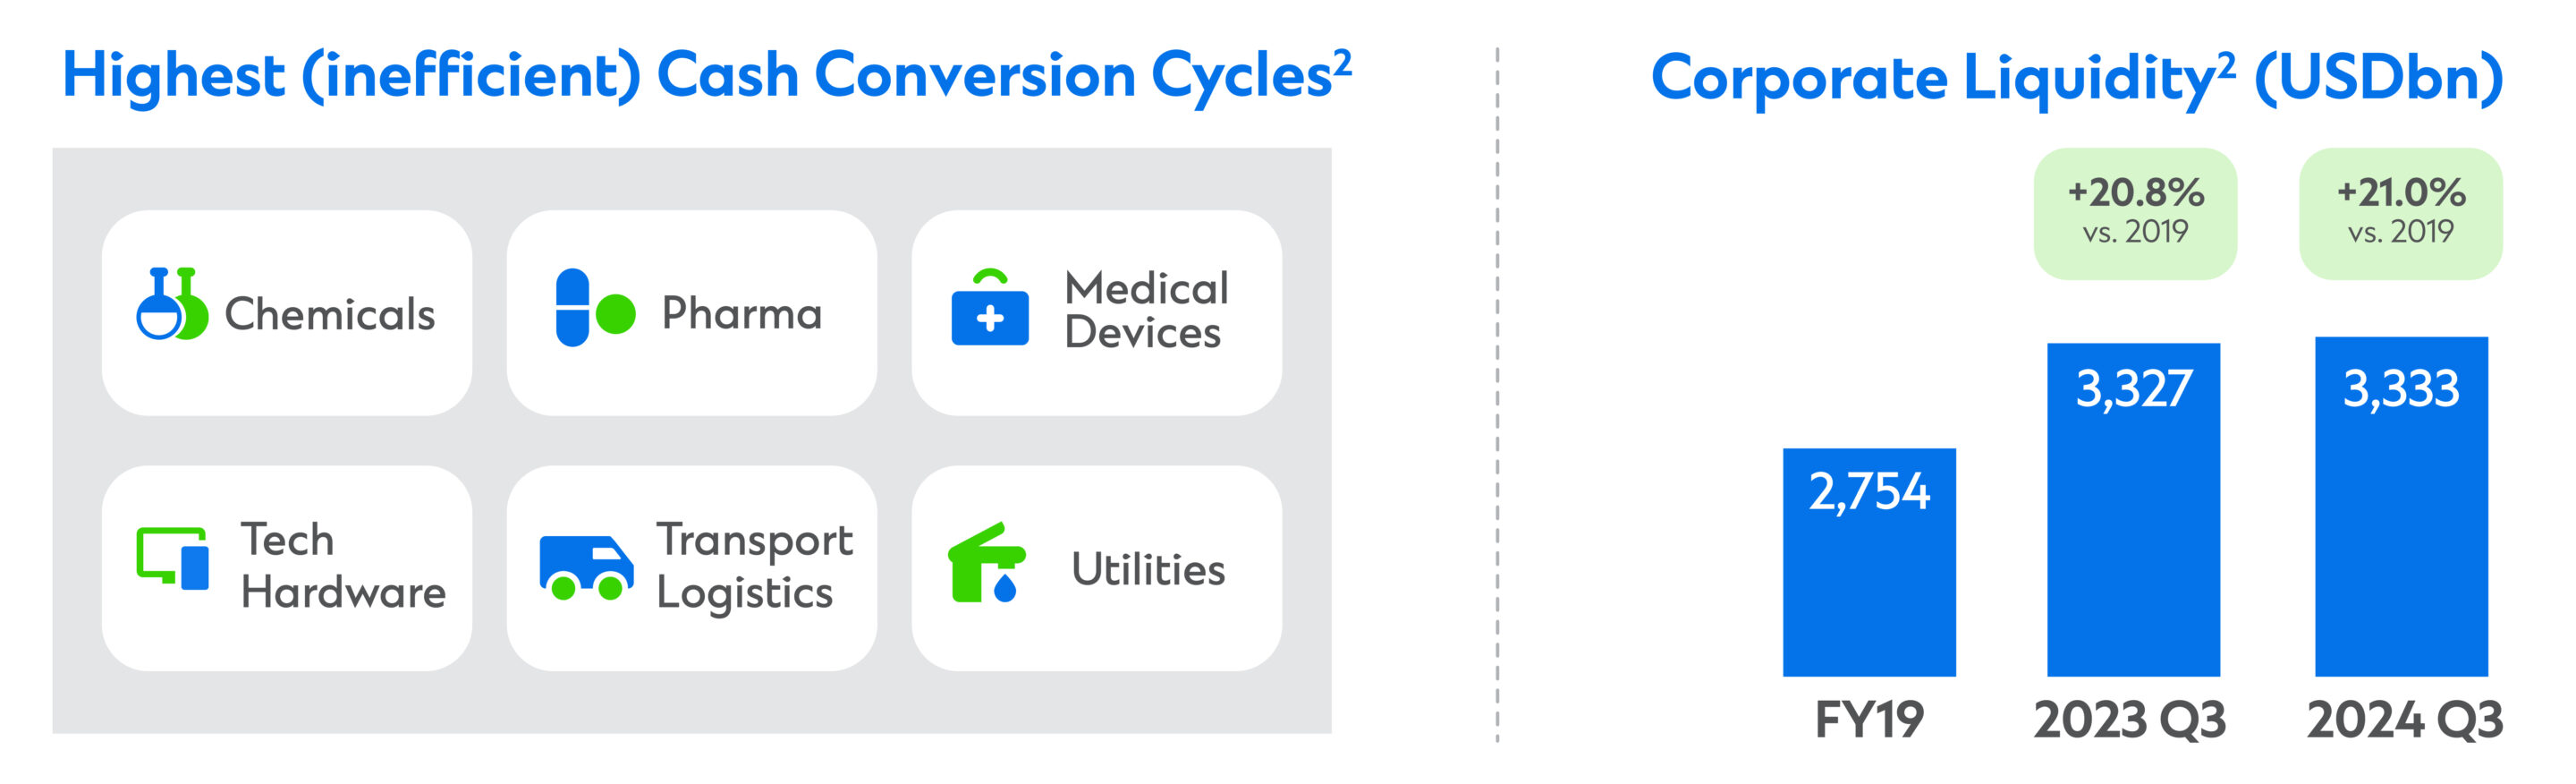
Our analysis reveals that working capital days have deteriorated, with six of the 18 sectors experiencing their most inefficient cash conversion cycles (CCCs) since 2019.
Corporates must address these inefficiencies, as efficient CCCs generally help support higher ROIC and valuation multiples.
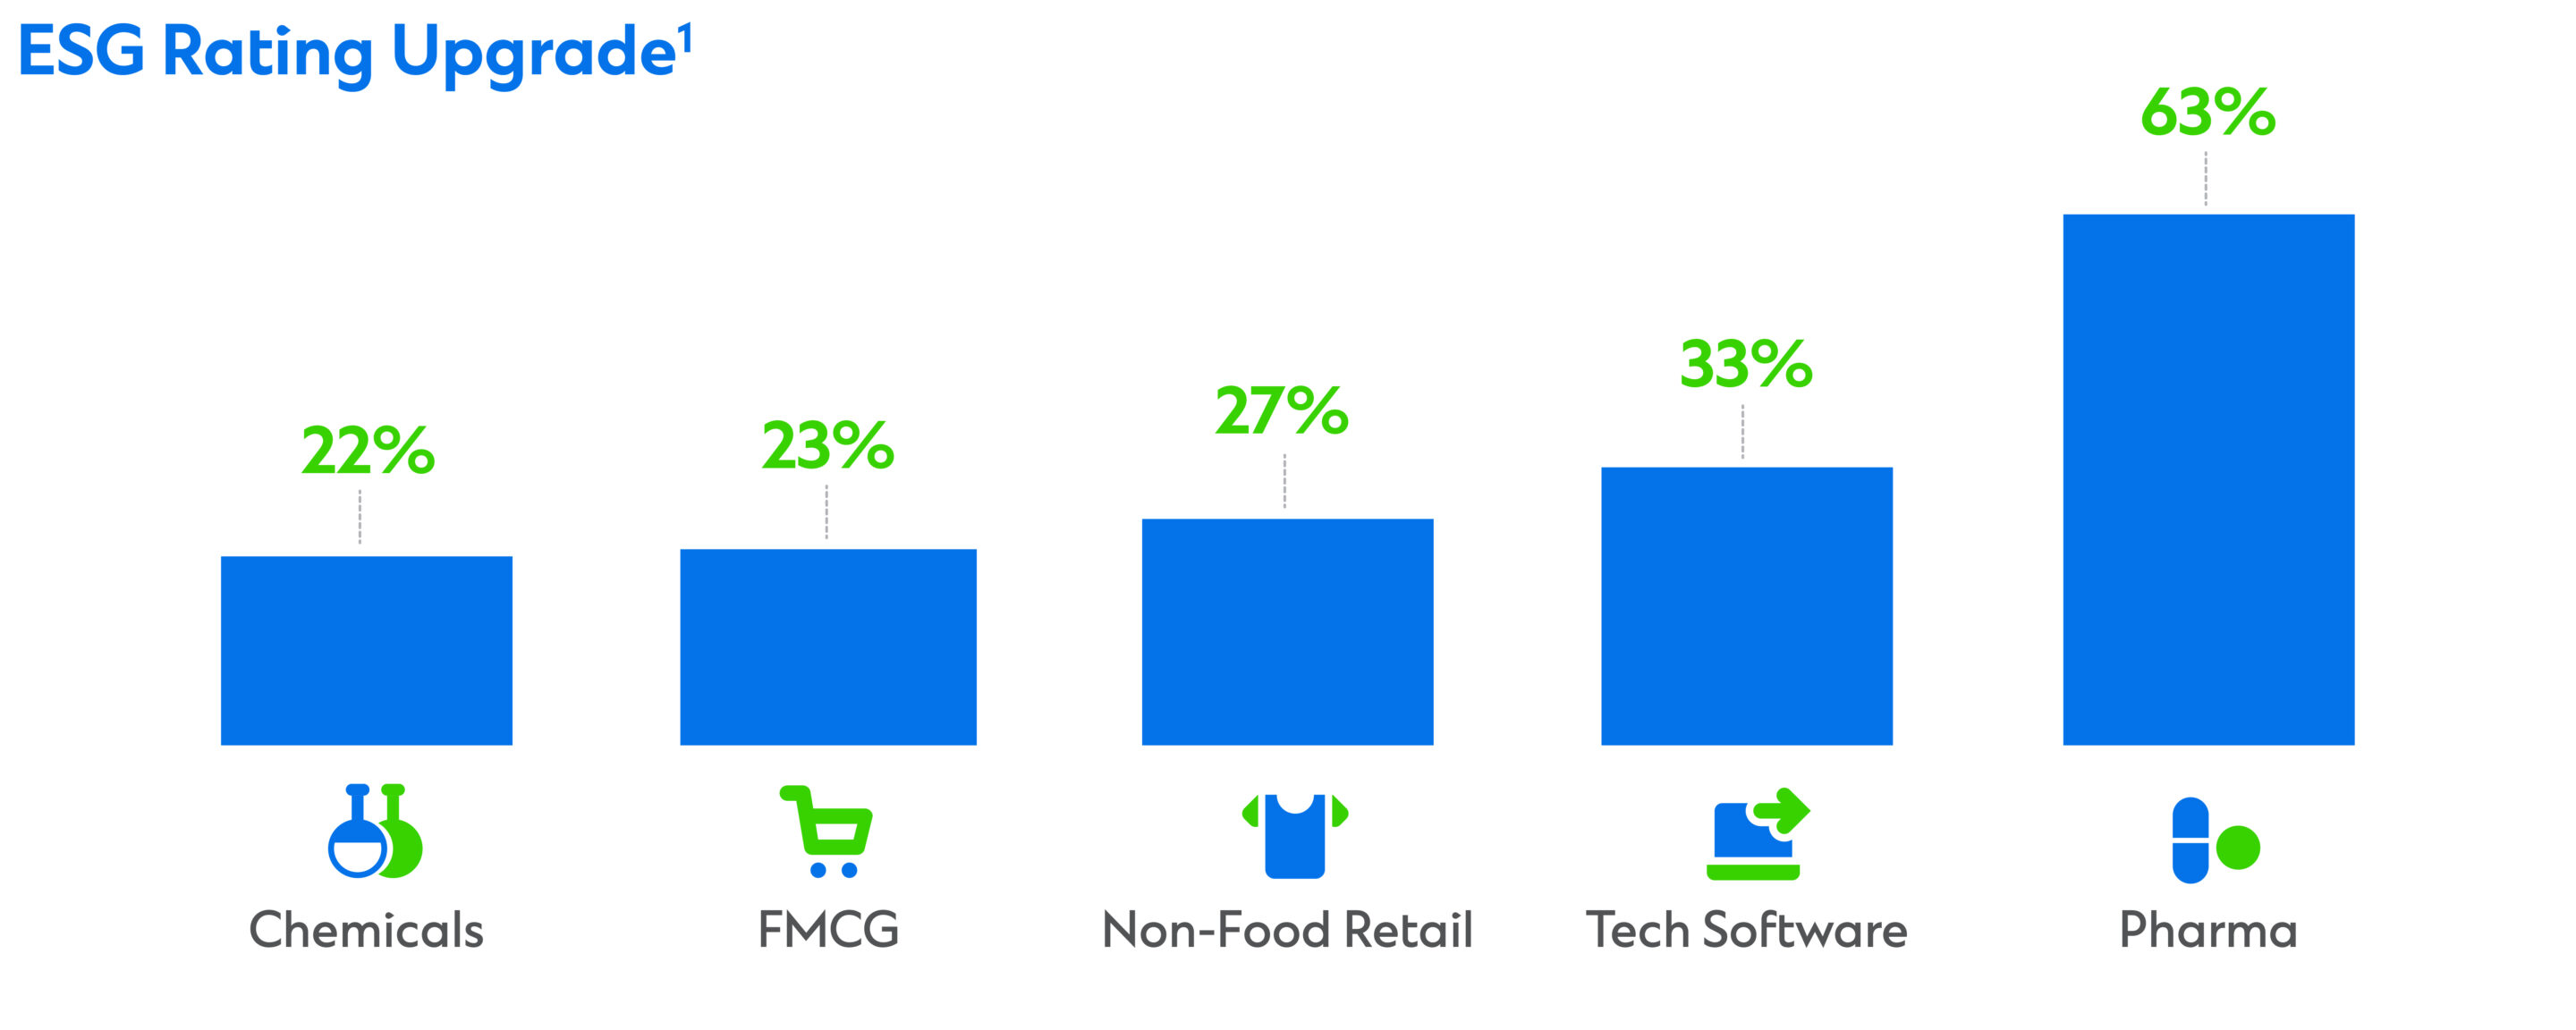
Continued focus on ESG leads to improved ratings
It is encouraging that most sectors have made significant progress in developing and communicating ESG disclosures effectively since the end of 2023. According to MSCI Scoring, the Pharma sector saw the highest number of ESG upgrades over the last year.
However our report reveals addressing the substantial gap between emerging and developed markets’ ESG scores will be vital. While corporates in the developed world showcase robust risk management and governance scores, emerging markets are still struggling. Bridging this gap may help with investors and other stakeholders engagements.
Note: (1) Based on MSCI Scoring latest vs 2023.
What does it mean?
If there’s one key takeaway from our review, it’s that sector-specific strategies are more important than ever.
For corporates navigating volatile sectors, maintaining cash buffers can be crucial for weathering potential fluctuations. However, in some cases, this risk may be overstated. On the other hand, businesses with ample debt headroom should seize the current market momentum and act more decisively.
Streamlining working capital and addressing liquidity inefficiencies can be tackled relatively easily. Therefore, prioritising cash cycles and refining sustainable cash buffers should be at the forefront of most sectors’ minds.
Lastly, despite the challenges, companies that remain steadfast in improving their ESG reporting and scores will stand to benefit, as the long-term financial cost of inaction is likely to be significant.
With our deep understanding of these dynamics, Standard Chartered is here to help craft tailored strategies that align with your internal goals, sectoral realities and the broader economic landscape.
Explore more insights
The appeal of infrastructure investment in dynamic markets
Infrastructure investment is a priority sector.