29 July 2022
Global Market Outlook
Global Market Outlook
The many walls of worry
The mood in financial markets is shifting away from worries about inflation to worries about growth as a result of the Fed’s aggressive monetary policy. For risk assets, though, bad news has been good news as the rise in long-term bond yields has halted.
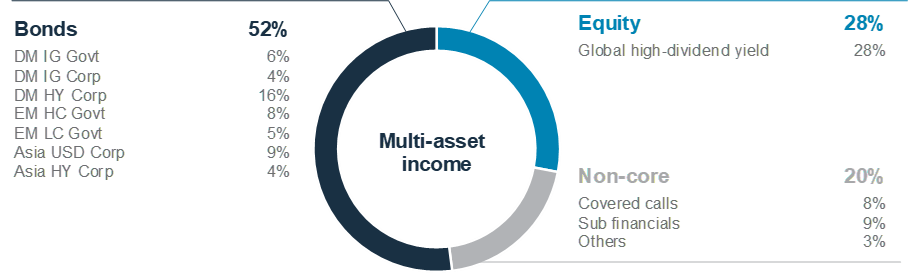
We continue to see income-driven multi-asset allocations, adding exposure to bonds at the expense of equities and a preference for Asia ex-Japan equities as three strategies that are most likely to balance growth and inflation worries.
Increasing worries about growth have also dragged commodity prices. However, we expect a floor to emerge under oil amid continued tight supply, while gold could rebound as the USD and bond yields peak.
What is the outlook for a balanced 60/40 portfolio?
What are the macro factors to watch?
What are your quant models indicating?
Strategy
Investment strategy and key themes
|
|
||||

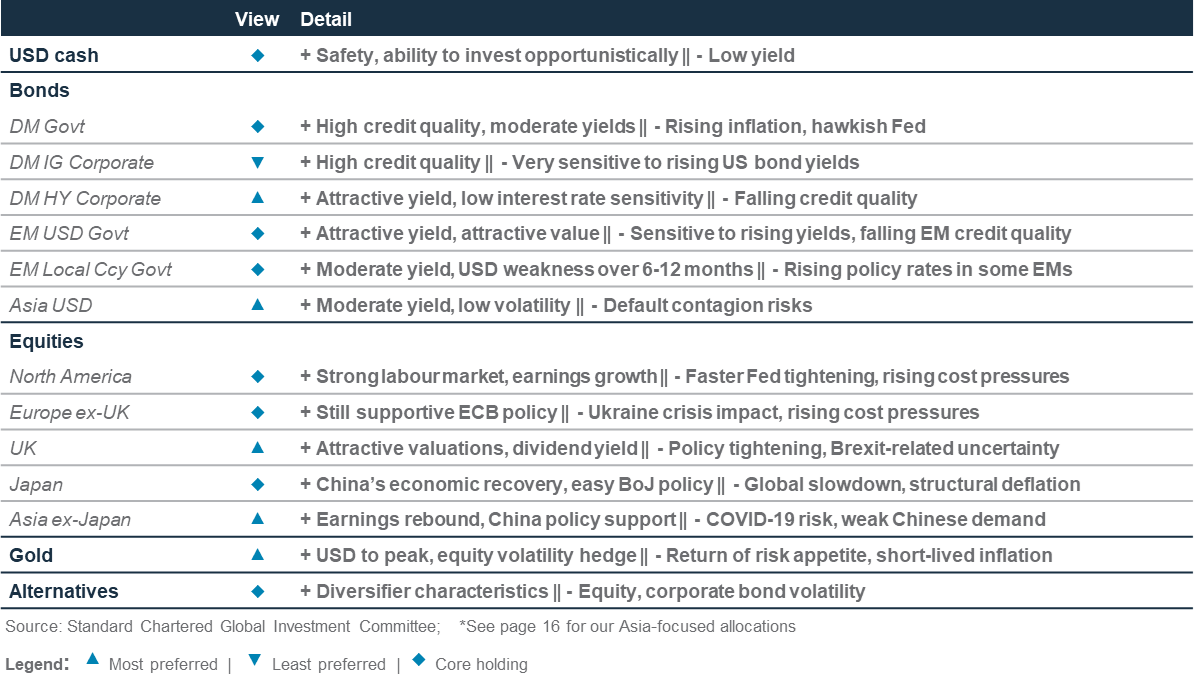
Our preferences (12-month view)
Foundation allocation preferences
- Prefer Gold
- In equities: Asia ex-Japan and the UK
- In bonds: DM HY, Asia USD
- In FX: Bearish USD; bullish EUR, GBP, AUD, NZD, CAD
Sector preferences
- US: Energy, Financials, Healthcare
- Europe: Energy, Financials, Healthcare
- China: Energy, Financials, Industrials, Comms. Services, Materials
Longer-term themes
- The Winds of Climate Change
- Clean Technology, Electric Vehicles, Water Scarcity, Infrastructure/ Green Capex
- Embracing a Digital Future
- Cybersecurity
- China’s ‘Common Prosperity’
- Hard Tech/Semiconductor, Renewables
The many walls of worry
- The mood in financial markets is shifting away from worries about inflation to worries about growth due to the Fed’s aggressive policy. For risk assets, though, bad news has been good news as the rise in long-term bond yields has halted.
- We continue to see income-driven multi-asset allocations, adding exposure to bonds at the expense of equities and a preference for Asia ex-Japan equities as three strategies that are most likely to balance growth and inflation worries.
- Increasing worries about growth have also dragged commodity prices. However, we expect a floor to emerge under oil prices amid continued tight supply, while gold could rebound as the USD and bond yields peak.
What should I worry about?
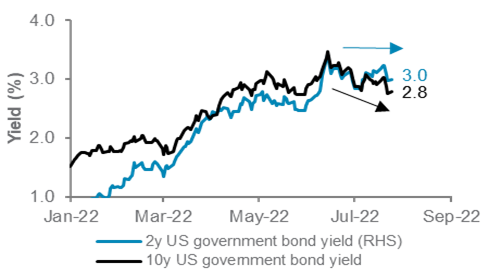
Over the past month, there has been a perceptible shift away from worries about inflation alone to worries about what the Fed’s actions to quell inflation mean for economic growth. Somewhat counterintuitively, this has had a positive impact on financial markets as growth worries have started to cap long maturity bond yields.
From an asset class perspective, a few trends in recent weeks stand out to us: (i) while short term yields have continued to rise in response to higher Fed rates and still-high inflation, long-term bond yields have remained increasingly capped as growth worries mount; (ii) bad news has been good news for equities as reduced pressure from bond yields and fund manager surveys showing extremely bearish positioning likely helped; (iii) oil and industrial metals tumbled amid worries demand would falter, especially amid renewed Covid outbreaks in China and (iv) gold fell as the past rise in yields and the US Dollar took their toll.
Nevertheless, our views from the H2 Outlook remain unchanged. Central banks continue to be on a tightrope between capping inflation (with some success, judging by tentative cooling of inflation expectations) and avoiding a deep downturn (potentially with less success judging by recession indicators, such as the inversion of the yield curve). We continue to see multi-asset income assets, a rising allocation to bonds and a focus on Asia ex-Japan equities as three ways to navigate this environment in foundation allocations.
Fig.1 Long–maturity bond yields have declined lately as economic growth worries rise
US 2-year and 10-year government bond yields
Keeping foundations unchanged
The modest rebound in high-dividend-yielding equities, a pullback in long-maturity bond yields and a bounce in High Yield (HY) bonds have been recent positives for multi-asset income strategies. While growth worries could still create some volatility, we believe the c.6.3% yield on offer and the likelihood of a continued outperformance of long-maturity bonds and high-dividend-yielding equities in an environment of growth worries will be supportive for the strategy.
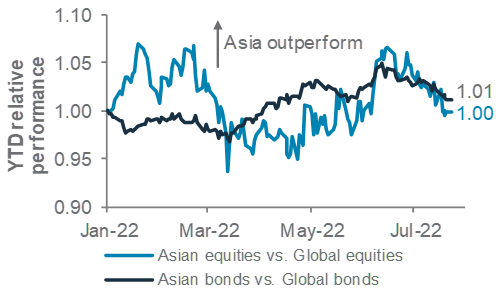
Fig. 3 Asian equities and USD bonds have performed in line with global peers despite recent weakness
Asian equities and USD bonds vs global benchmarks
Meanwhile, global equities have outperformed bonds slightly since mid-June lows, though the two have largely moved in tandem. We remain comfortable with our view of adding exposure to bonds at the expense of equities, especially as growth concerns rise, but re-emphasise the need to retain a balanced stance between the two (see Fig. 2).
Our regional preference for Asian equities (and China equities within that) has been challenged in recent weeks amid a stream of negative headlines. Recent volatility notwithstanding, we note Asian equities have continued to outperform global equities from the start of Q2 22 (relative performance for Asian bonds shows a similar pattern). We remain comfortable with our preference for Asia ex-Japan equities as we believe valuations remain at levels that more than incorporate recent concerns in China.
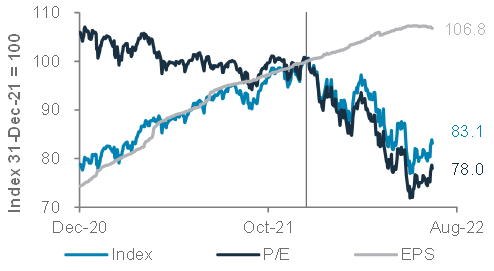
Fig.2 EPS is likely to fall amid growth worries, but usually tends to lag the fall in valuations
S&P500 index, P/E ratio, earnings per share
Two worries for credit markets
There have been concerns about whether US and European HY bonds are at risk if recession worries do indeed pan out. Credit spreads (ie, yield premium over Treasuries) on US HY bonds are currently at levels comparable with the 2018 sell-off, the level of equity volatility and our assessment of the relatively good credit quality of US corporates.
While a return to 2020 recession peaks would mean an approximate doubling of this yield premium, we would note that (i) such a move would most likely need a deep recession and (ii) history shows such moves are usually quite short-lived, given the attractive yield starts offsetting negative price returns much more quickly than for equities. We continue to see US and European HY bonds as preferred.
A second area of concern has been the possibility of rising defaults in Emerging Market (EM) USD government bonds as the USD stays strong and USD borrowing costs rise. This is arguably already reflected in yield premiums that are at their highest since 2020. Having said that, we would note (i) the EM USD bond asset class remains well diversified, with each sovereign issuer comprising less than 5% of the total asset class and (ii) Emerging Markets scoring relatively low on a range of debt and liquidity metrics have remained arguably small in number so far. While history demonstrates it is prudent to be on watch for contagion risks, we do believe valuations have already factored in a significant amount of stress. We retain a ‘core holding’ view on EM USD government bonds.
What matters for oil? Demand or supply?
Have oil prices peaked? The recent peak does coincide with rising concerns about slowing economic growth, which is likely to impact oil demand. However, we would note that supply remains highly constrained by most measures, leaving the market at the risk of a grind gradually higher, especially if China’s policy efforts to support growth are successful. This is likely to limit the weakness in energy sector equities, in our assessment.
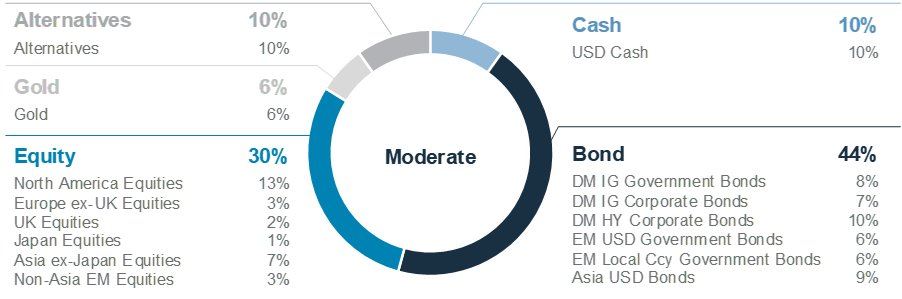
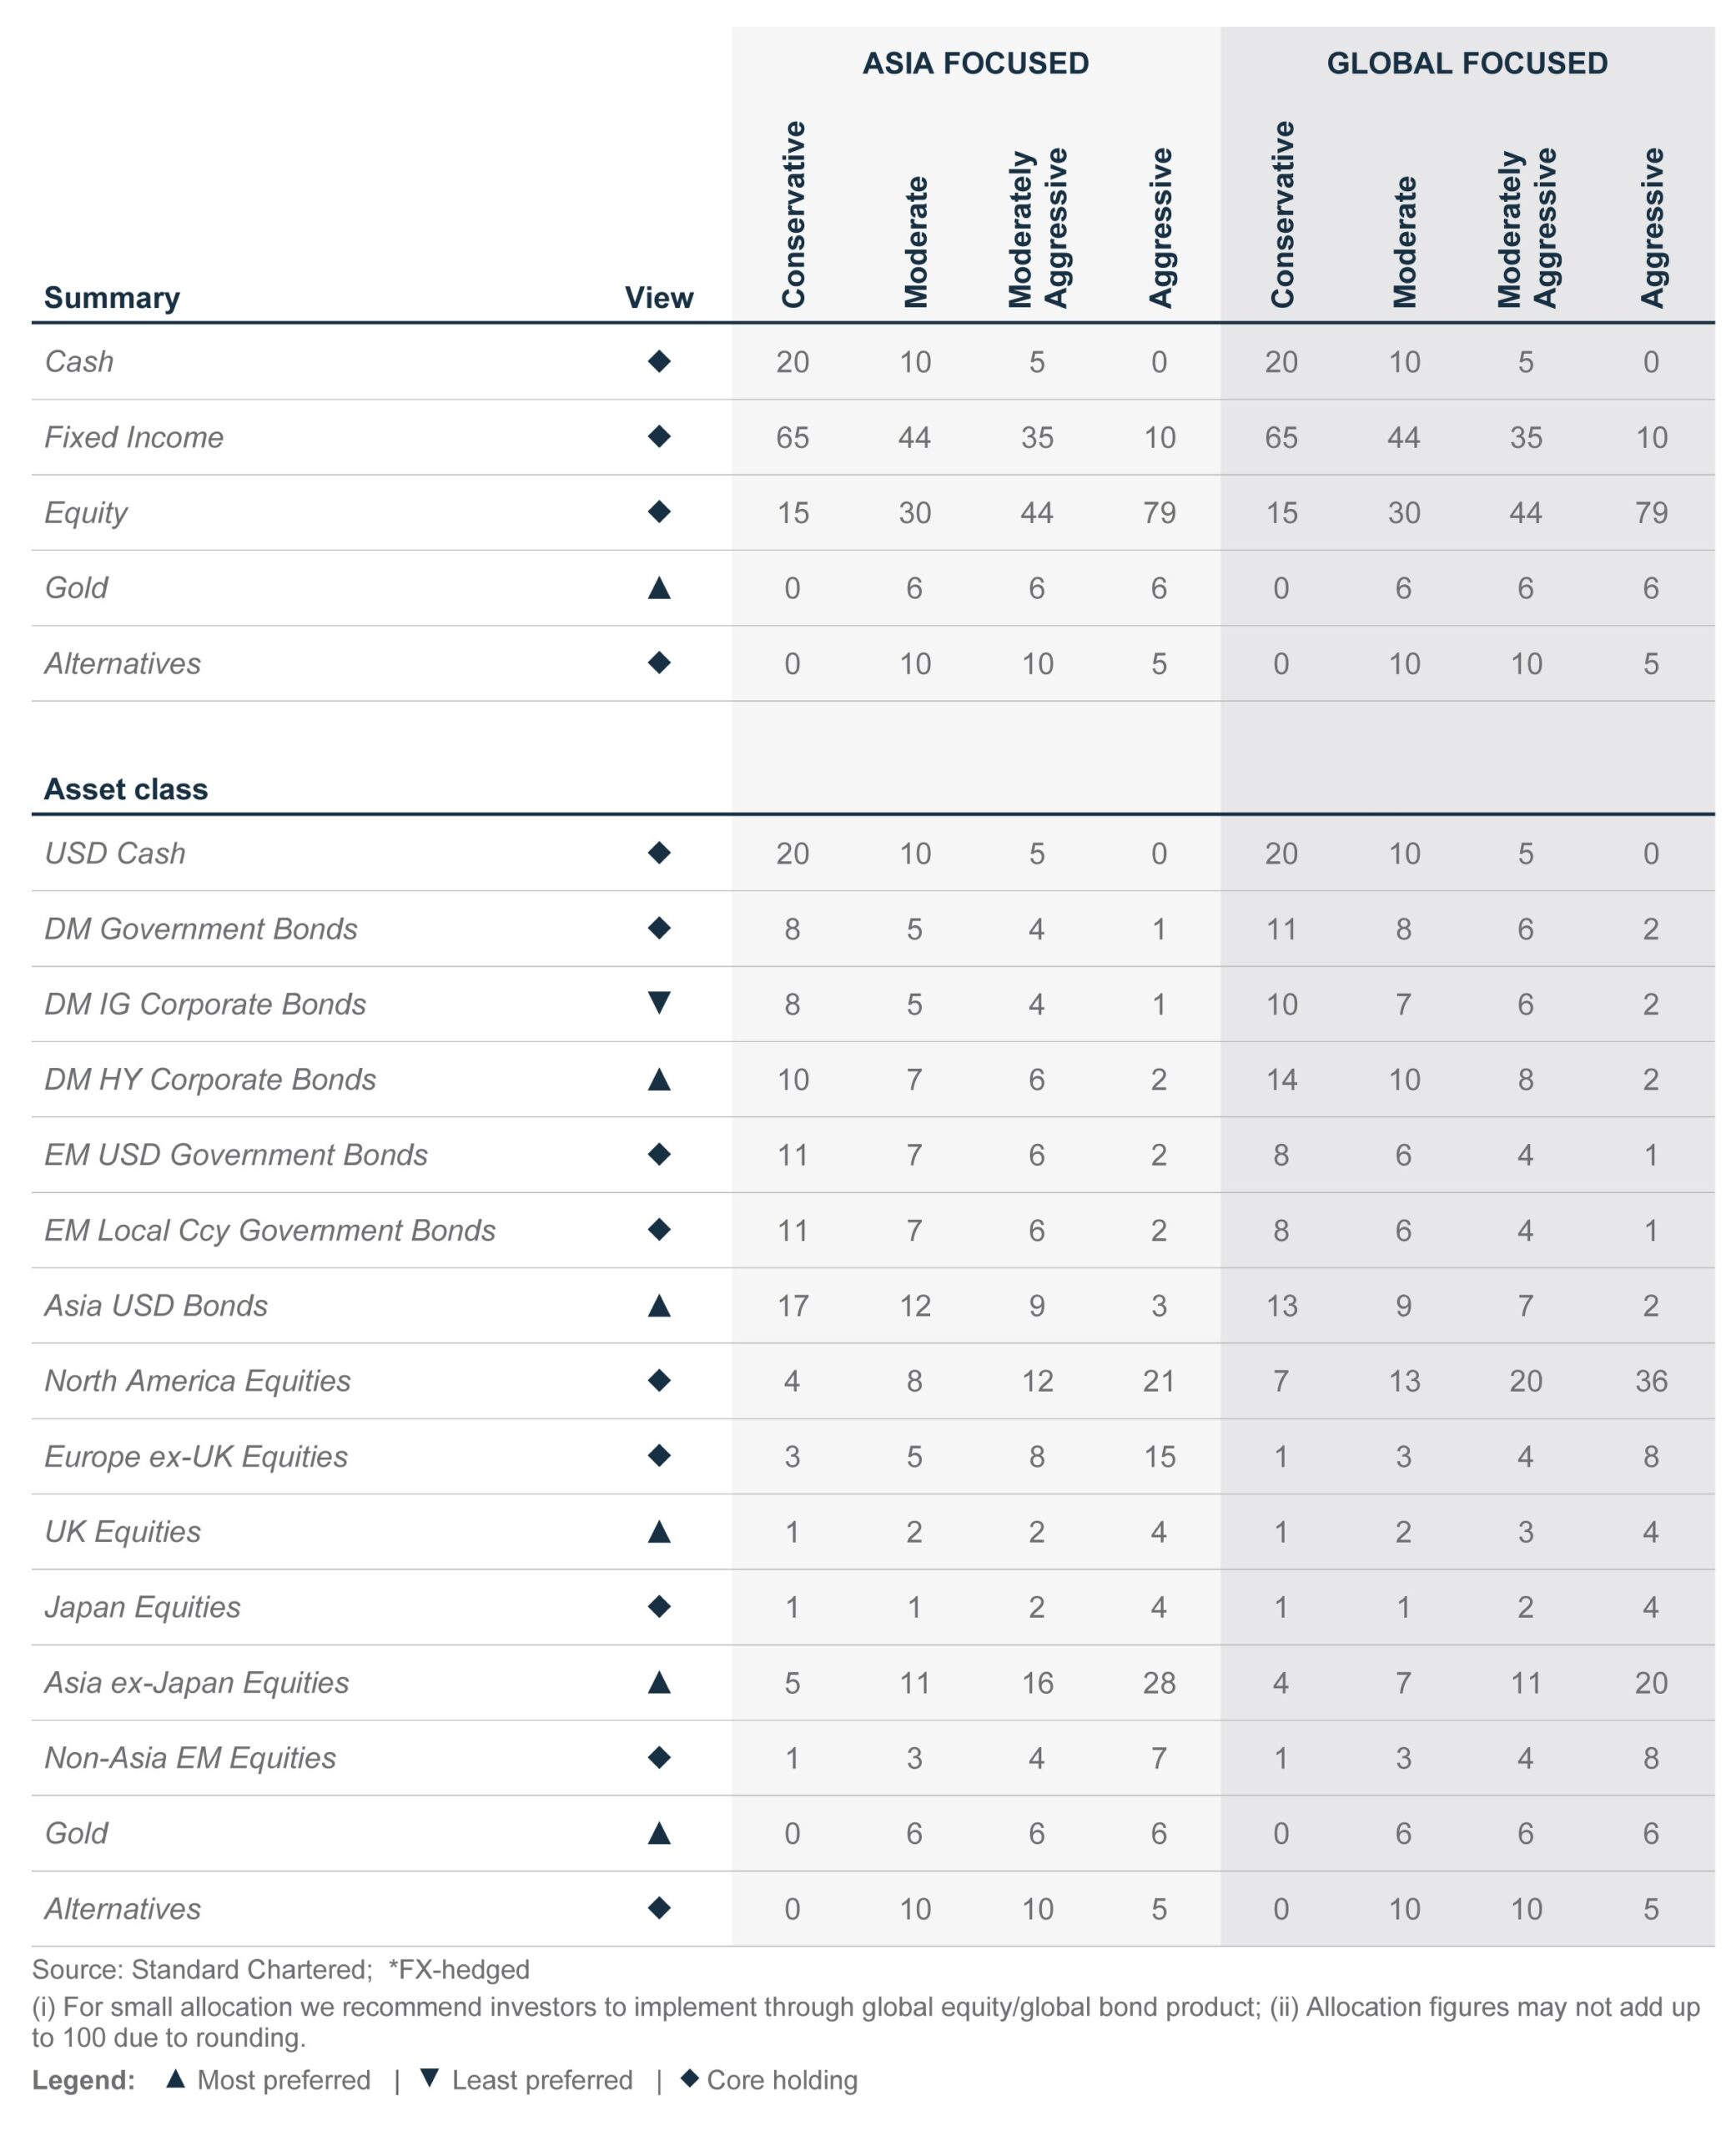
Foundation: Tactical asset allocation
Global* allocation model for a moderate risk profile
Multi-asset income allocation model for a moderate risk profile
Perspectives on key client questions
|
What is the outlook for a balanced 60/40 portfolio?
Investors have witnessed a painful start to the year. Both global bonds and equities are down 15.6% and 12.4%, respectively, driving a 60/40 allocation 14.3% lower YTD, making it one of sharpest declines over the past 150 years. High inflation, the Ukraine war and unprecedented tightening by central banks have weighed on investor sentiment, triggering concerns about a protracted growth slowdown.
Will the sell-off continue? How will risk assets perform in H2 22? There is clearly an unusually high degree of uncertainty on the outlook, given that the world has not witnessed such an environment of high inflation and slowing growth in the last four decades. Under such circumstances, the natural human tendency – psychologists call it ‘recency bias’ – is to extrapolate the first half’s pain into the next few quarters. However, in times like these, it would be equally important to remind ourselves that it is rather unusual to have both bonds and equities declining at the same time.
A review of the history of US financial markets provides some reassuring facts. Over the past 150 years, there have been only four years – 1931, 1941, 1969 and 2022 YTD – when US bonds and equities both declined (Fig. 4). A typical 60/40 stocks-bonds allocation posted nine annual losses of more than 10% since 1872 (including 2022 YTD). The only occasion where a 60/40 allocation suffered two consecutive years of losses exceeding 10% p.a. was during 1930-1931 in the midst of the Great Depression (Fig. 5).
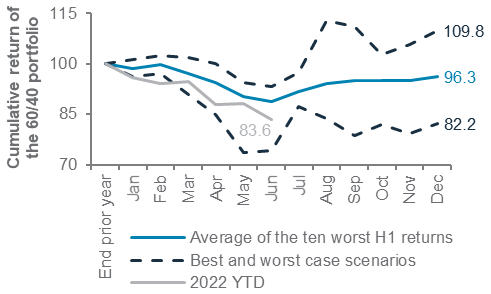
Returns to date have tracked some of the worst first-half episodes for a 60/40 portfolio. However, after a dismal H1 22, history shows returns tend to improve in the second half. Today, investor sentiment and positioning are also extremely bearish, suggesting it may not need much of a reversal in sentiment for a technical rebound. Thus, history suggests long-term investors should lean against any recency bias.

Fig. 4 There have been only 4 instances since 1872 (including 2022 YTD) when both US bonds and equities posted negative returns
Historical annual return: bonds vs equities (%)
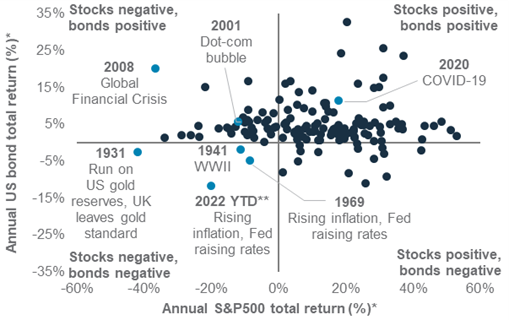
Fig. 5 A US 60/40 stocks-bonds portfolio has seen only 9 annual losses of more than 10% since 1872
Annual returns of the 60/40 portfolio (annual rebalancing)
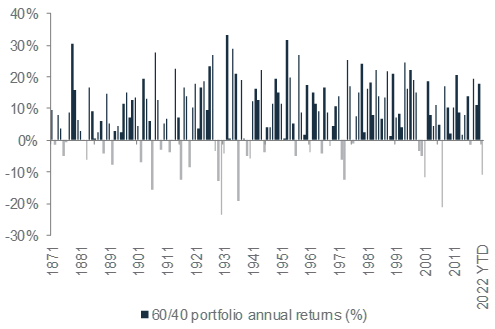
Source: Shiller, Robert. (2000). Irrational Exuberance (Princeton University Press 2000, Broadway Books 2001, 2nd ed., 2005), NYU Stern, Federal Reserve of St Louis, Standard Chartered. Total returns based on the S&P500 index and US 10-year constant maturity yield
Fig. 6 Potential rebound in 60/40 in H2 22?
Average and range of the 10 worst H1 22 returns of a 60/40 US equity-bond portfolio since 1872
However, the coast may not be entirely clear
The US economy slipped into a technical recession in H1 22, with initial estimates showing that the economy contracted by 0.9% in Q2, following a 1.6% decline in Q1 22. Business confidence indicators (PMIs) have deteriorated alongside a sharp decline in housing market activity as mortgage rates rose, though the US labour market has been extremely resilient thus far. The real question is whether the continued Fed policy tightening will drive the US economy into a deeper and protracted recession and earnings contraction, which markets have yet to price in.
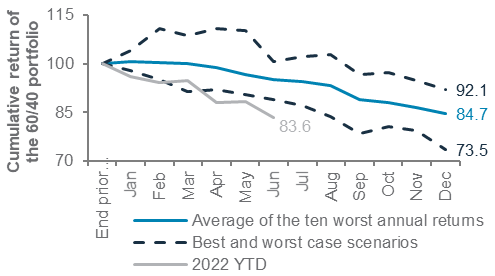
High and sticky inflation would raise the risk that the Fed continues to tighten even in a significant growth slowdown. While supply-chain bottlenecks have eased somewhat, shelter and services inflation have picked up more broadly. The risk of a disruption to Russia’s oil and gas supplies is also a factor that may drive the Fed to hike by more than the c.3.5% currently priced in by markets. Under this scenario, there could be further near-term downside to the 60/40 portfolio.
Fig. 7 Possibility of further downside to 60/40 in the event of protracted earnings and economic recession
Average and range of the 10 worst annual returns in a US 60/40 portfolio since 1872
Should we bottom fish?
Both upside and downside risks appear equally balanced for now, which suggests investors should remain broadly diversified without taking overly concentrated risks. It is hard to pinpoint the perfect time to invest. A peak in Fed rate expectations could be one such catalysts, as evidenced by the gains in equities and bonds after Fed Chair Powell hinted of a slower pace of rate hikes if inflation decelerates in the July FOMC meeting.
On the other hand, there is no need to excessively time the markets if one can be disciplined in investing on a regular basis. Broadening one’s investment allocation is a better way to improve the probability of achieving positive returns over the longer term.
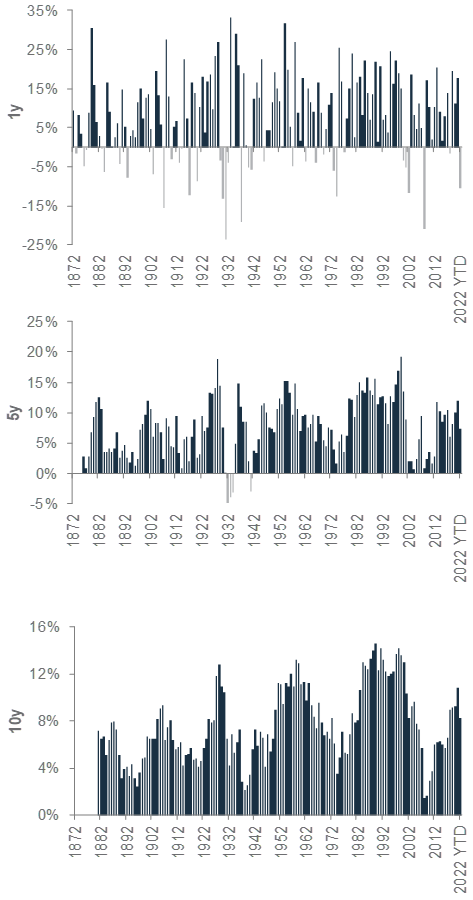
Fig. 8 Investors’ probability of achieving positive returns increases with a longer time horizon
US 60/40 portfolio annualised rolling returns (1872 – June 2022); 1-year, 5-year and 10-year rolling periods
Our thematic ideas
|
Key themes
Below we provide a brief overview of our open thematic ideas, coupled with some recent highlights.
The winds of climate change
The recent rebound in global markets has offered support to our climate-related themes. Our ‘Water’ theme has been an exception, outperforming global equities by c.8% since we published our H2 22 Outlook. However, valuations and earnings revisions remain less supportive.
In the near term, inflation pressures and an ongoing energy crisis remain headwinds for climate themes such as clean tech. However, we retain our conviction on the back of cost competitiveness versus fossil fuels and continued policy support worldwide for decarbonisation. Clean power remains the cheapest form of power generation despite recent cost increases, as reported by International Renewable Energy Agency in its latest Renewable Power Generation Costs report. Additionally, we continue to expect demand for clean energy sources to increase (BloombergNEF expects both wind and solar capacity to record higher installation volumes in 2022 compared with 2021).
Although markets are growing more cautious about rising recession risks, we believe that existing structural tailwinds could boost climate-related themes over the longer term, outweighing the short-term headwinds that have been dragging climate themes and broader global stocks this year.
Embracing a digital future
While our cybersecurity sub-theme recorded positive returns of 2% since the end of June, it has underperformed both global equities and the Nasdaq Composite index. Nonetheless, structural trends with the pandemic accelerating the pace of digitalisation, which has in turn highlighted the need for cyber resilience among businesses gives us confidence to retain our conviction over the longer term. Cybersecurity surveys have shown that the majority of C-level executives agree cyber resilience would be considered a business priority in 2022. The underlying shift towards a safer digital space can be seen in rising demand for cybersecurity products from a broad range of industries, from insurance to software and services. Thus, forecasts for cyber protection-related spending continues to increase. The global cybersecurity market is predicted to grow to USD 345bn in 2026, up from USD 240bn in 2022, according to Statista.
In terms of valuations, 12-month forward P/E currently trades at a premium relative to global equities (34.0x vs 14.8x). Although rate hike expectations and the inflation-growth outlook will remain dominant influences on the sector,
earnings revisions have ticked up. We believe this displays confidence in the theme’s fundamental outlook amid the ongoing market uncertainty. This supports our conviction.
China’s ‘Common Prosperity’
While the Renewables sub-theme of China’s ‘Common Prosperity’ thematic idea fell 7.9% since the end of June, we continue to remain positive on the sector. Long-term structural tailwinds remain intact, in particular for New Energy Vehicle (NEV) producers. We see the recent drop in 12-month forward P/E from its June peak of 23.4x to 20.3x as an opportunity to gradually add to positions.
Fig. 9 NEV market share gains are likely to slow in H2 22 as non-NEV sales recover, but there is still ample room before reaching China’s goal of 40% by 2030
Share of NEV and non-NEV sales as a proportion of total auto sales
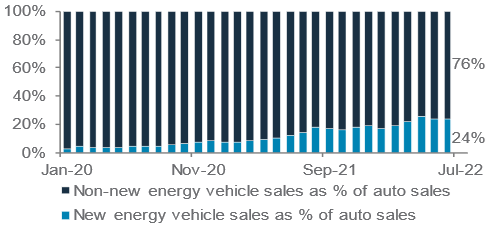
The easing of China’s COVID-19 lockdowns in June, and the subsequent release of pent-up demand, has propelled sales of NEVs to a new record high of 596,000 in June. YTD sales of 2.59m means full-year sales are on track to reach 6.00m, as estimated by the China Passenger Car Association. However, a high base in Q4 21, a reduction of sales tax that is likely to primarily benefit internal combustion engine vehicles (ICEV), a renewed COVID-19 wave and a risk of a slowdown in immediate demand in the event of an extension of subsidies into 2023 mean NEV sales could start to slow on a y/y basis, allowing ICEVs to regain some market share in the near term. Nevertheless, monthly NEV sales are still likely to see healthy, albeit slowing, double-digit percentage growth from the previous year, enabling FY 22 sales to increase by c.70% from 2021. Over a longer horizon, the phasing out of ICEV production in 2025, as recently announced by some Chinese automakers, and the country’s goal to lift the share of NEV sales as a proportion of total auto sales to 40% by 2030 mean that strong structural demand for NEVs is likely to remain in place in the coming years.
Macro overview at a glance
Summary
|
|
||||
Key themes
Economic activity in the US and Europe and long-term inflation expectations have slowed significantly over the past few months as tighter financial conditions since the start of the year dampen business and consumer confidence. While the Fed and the ECB have signalled their willingness to continue tightening monetary policy until near-term inflation declines sustainably for a few months, we believe the window for further tightening is closing rapidly. Fed Chair Powell this week hinted at a potential slowing in the pace of hikes. Thus, we see another 75bps of Fed rate hikes and 50-75bps of ECB rate hikes by the end of the year, mostly in Q3, before a sharper economic slowdown and slowing near-term inflation cause the central banks to pause.
In contrast with the US and Europe, China’s economy has started to recover. China’s business confidence indicators (PMIs) reflected an expansion of economic activity in June for the first time in three months as credit growth picked up. A renewed COVID-19 wave is likely to delay a complete re-opening of the economy, at least until the Communist Party Congress (expected in Q4 22), keeping consumer confidence subdued. Nevertheless, authorities continue to take steps to accelerate infrastructure projects, including the advancement of local government borrowing plans from next year. We are also watching government measures to support the property sector amid growing signs of borrowers’ stress.
Key chart
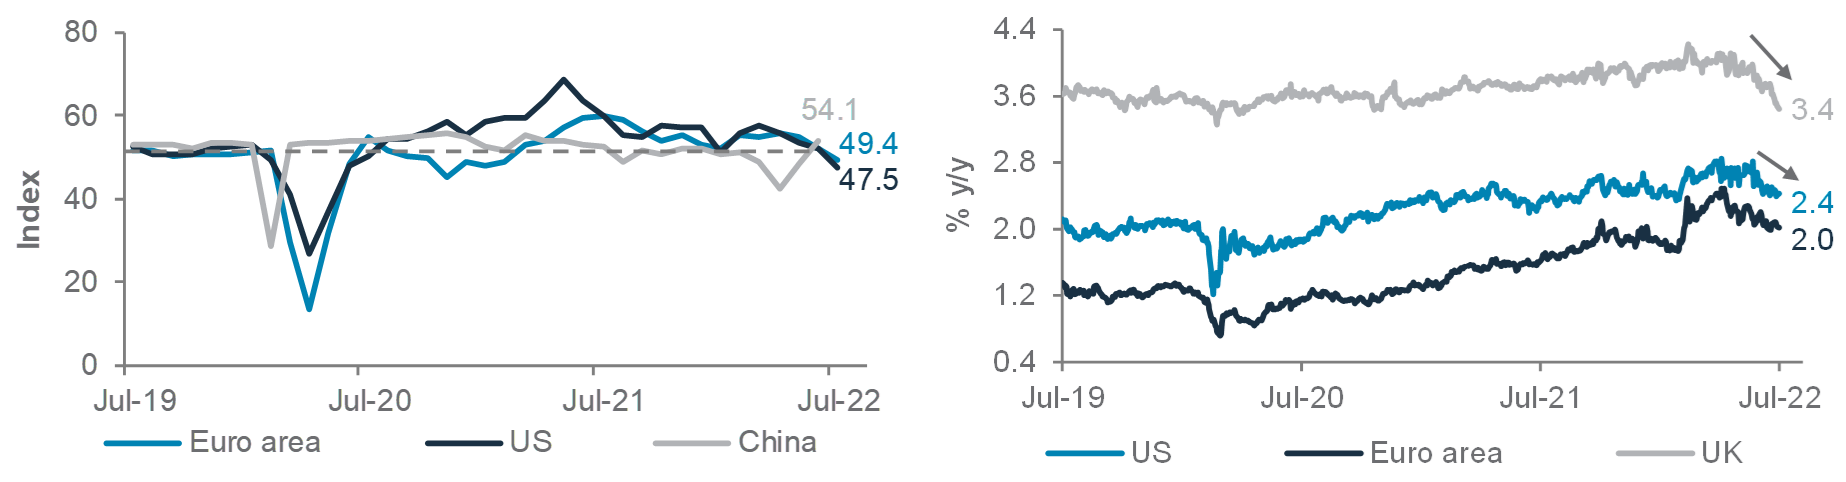
Slowing economic activity and peak in inflation expectations should enable the Fed and the ECB to slow the pace of rate hikes in H2 22. China’s economy is recovering from the slump in Q2 22
Fig. 10 US and European economic activity and inflation expectations are slowing
US, Euro area and China PMIs; US, Euro area and UK long-term inflation expectations*
Macro factors to watch
- Slowing activity in the US and Europe: The US economy contracted for the second straight quarter in Q2 and composite PMIs in the US and Euro area fell below the critical 50 mark, which signifies activity is starting to contract. This year’s tighter financial conditions – caused by sharply narrower budget deficits, rising interest rates, falling equity markets, a strong USD (in the case of the US) and surging energy costs (especially in Europe) – are hurting consumer and business confidence. The sustained inversion of the US 10-year vs 2-year government bond yield curve and the significant flattening of the 10-year vs 3-month yield curve in recent weeks point to an elevated risk of a US recession in the coming quarters. Job markets remain tight both in the US and Europe, supporting consumption, but rising jobless claims in the US suggest cracks are starting to appear.
- Peak inflation, central bank policy: US and European long-term inflation expectations have slowed significantly in recent weeks, with a pullback in oil prices, amid rising concerns about a growth slowdown. However, near-term inflation continues to set multi-decade highs. We believe this creates a challenge for the Fed and the ECB in the near term. Both central banks have prioritised taming inflation lately. However, we believe we are close to the point when central banks pivot back towards supporting growth as near-term inflation peaks in H2 22 and growth slows sharply, affecting job markets. Fed Chair Powell’s comments this week reaffirm this view. Thus, we expect the Fed to pause hikes once it raises rates 50-75bps above its neutral rate of 2.5% in H2 22, especially if the US jobless rate starts to rise towards its long-run 4% estimate.
- Russian energy supplies: Russia’s energy supply policy holds the key to Europe’s outlook in H2 22. The decision by Gazprom to declare force majeure on gas supplies to Europe, despite restarting the Nord Stream 1 pipeline after a scheduled maintenance, raises the risk of a halt in supplies in the coming months. Such an event is likely to sustain Europe’s energy price-driven inflation, forcing the ECB to keep tightening policy despite slowing growth.
Asset Classes
Bonds – at a glance
|
|
||||
Key themes
Major central banks have been maintaining a tightening bias, with the Fed and ECB hiking rates by 75bps and 50bps in July as they attempt to curb inflation pressures. However, bond markets are increasingly pricing in the risk of an economic slowdown owing to the tighter financial conditions. As a result, we see rising downside risks to our 12-month view of US 10-year government bond yield expectation of 3.25%. Although we continue to view Developed Market (DM) Investment Grade (IG) government bonds as a core holding, we would view any sharp moves higher towards 3.25% as an opportunity to add exposure to bonds at the expense of equities, given the elevated risks to growth.
DM HY corporate bonds remain a preferred holding as we continue to believe that the current valuations have largely priced in a mild recession. Relatively strong corporate balance sheets, adequate interest coverage, a sharp reduction in supply and benefit from higher commodity prices argue well for continued outperformance. Asian USD bonds are preferred as we expect growth in China to accelerate in H2 22 and foresee higher demand from onshore investors.
Key chart
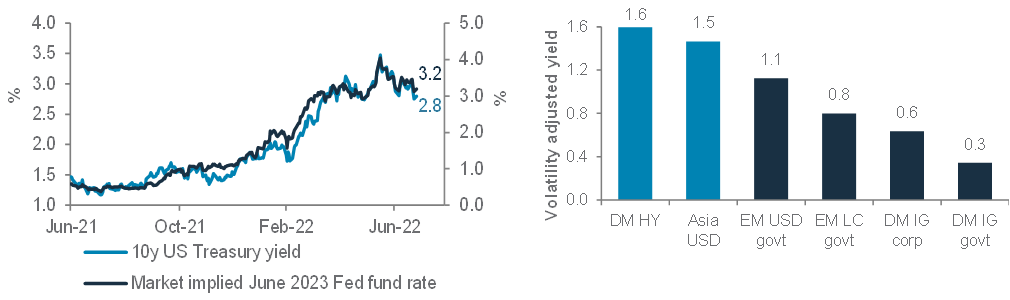
Decline in US government bond yields and rate hike expectations since June signals greater pricing of recession risk; Asian USD and DM HY bonds offer the most attractive yield for the risk taken by investors
Fig. 11 We favour Asia USD and DM HY bonds as they remain attractively valued
Market-implied Fed rate for June 2023 and US 10-year government bond yield; volatility- (risk) adjusted yield on offer for various bond asset classes
How should investors position their bond allocations given the looming growth risks?
Growth momentum has clearly stalled over the past few months as US entered a technical recession based on Q2 GDP data, while European economic growth is expected to slow down sharply. The surprise contraction in PMI data in July adds to the growth concerns, at a time when central banks remain firmly focussed on combating inflation.
In our assessment, US government bonds have started to price in a greater degree of a protracted economic slowdown. Since its peak in June 2022, the US 10-year government bond yield has declined nearly 70bps, in line with sharply lower interest rate expectations. In fact, the gap between 10-year and 2-year yields, a widely followed recession indicator, is more negative than it has been leading up to the prior two recessions. The combination of an inverted yield curve and a decline in bond yields over the past two months signal that the US government bonds market is pricing in rate cuts in 2023. We raised DM IG government bonds to a core holding last month and favour a 5-7 year maturity profile, as we view them as a reasonable hedge against a recessionary outlook.
Within corporate bonds, we believe DM IG corporate bond spreads have not risen adequately given the increase in risks, and, therefore, offer an unattractive risk reward. We prefer to take our higher quality corporate bond exposure through Asian USD bonds, which have over 80% weight to IG bonds, with similar overall credit ratings to US IG corporate bonds. Asian USD bonds also offer extremely attractive yield premiums over their US counterparts and benefit from a better macroeconomic backdrop, as we expect growth in China to rebound in H2 22 and growth in other Asian economies, such as India, Indonesia and the Philippines, to remain robust.
We favour DM HY bonds as well, despite its strong performance in recent months, which has led to a reduction in yield premiums in the US. Our assessment suggests that current valuations have priced in a mild US recession and the rise in default rates to c.5%. This stands out as compelling once we factor in the relatively strong balance sheets and interest coverage ratios at an aggregate level. In addition, the sharp reduction in the supply of new bonds suggests that we are likely to see net negative supply in 2022. which should provide a sizeable offset against any potential outflows.
Equity – at a glance
|
|
||||
Key themes
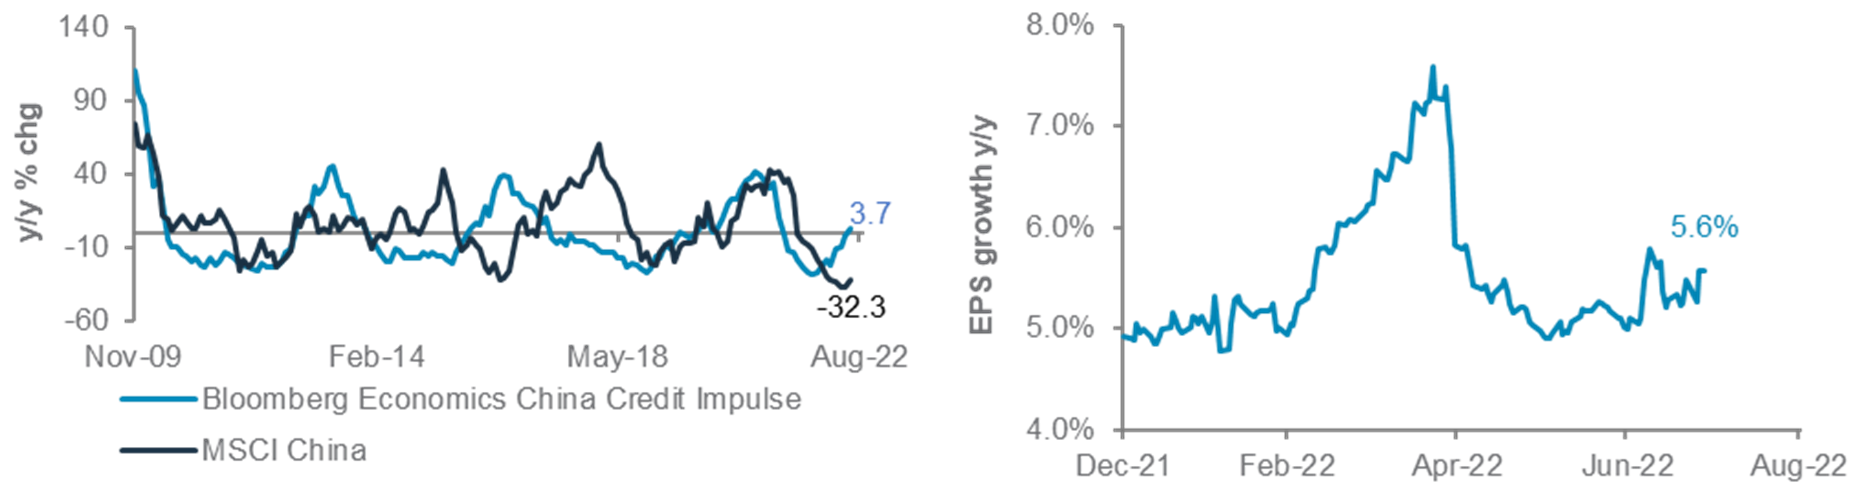
Global equities remain a core holding on a 12-month horizon. The US Q2 FY22 earnings season indicates that earnings have remained relatively robust, with the consensus expecting earnings to grow by 5.6% y/y, up from 5.1% estimated before the start of the earnings season. However, companies have been cautious in their guidance, especially on margin pressures.
Concerns about recessionary risks have led to a pullback in US government bond yields, resulting in relatively better performance of Growth over Value stocks. There is also an emerging narrative that the Fed may not deliver as many rate hikes as projected, which may eventually revive the idea of a ‘Fed Put’, which would be supportive for equities.
Asia ex-Japan remains a preferred equity market – the region’s valuations are relatively undemanding, with its 12-month forward P/E ratio at a 16% discount to global equities. China has continued to step up its policy support. Signs of more pragmatic adjustment in China’s ’Zero-COVID‘ policies should help to sooth fears of the return of stringent lockdowns. Risks include the impact of the ongoing uncertainty around mortgage repayments by some borrowers, which could impact near-term sentiment.
Key chart
Asia ex-Japan equities may outperform as China credit impulse improves with stimulus measures. US Q2 FY22 earnings have beaten expectations so far, though guidance has been cautious
Fig. 12 Asia ex-Japan and China equities may outperform global equities as China credit impulse improves. Better-than-expected earnings in the US supports sentiment
Bloomberg economics China credit impulse and MSCI China index changes y/y. Consensus y/y growth of US Q2 FY22 earnings
Searching for growth
The stronger-than-expected US Q2 FY22 earnings so far have helped soothe concerns about an impending recession that has hurt global equities. For the financial sector, concerns about the effect of inflation and rising borrowing costs on corporate and mortgage lending have been offset by factors such as better-than-expected financial trading activities.
More importantly, the narrative about policy overtightening is shifting slowly to concerns about recessionary risks. Thus, the Fed may not be able to deliver as many rate hikes as markets expect. This has capped the rise in long maturity bond yields and helped support the valuation of Growth stocks.
Growth stocks are common in sectors such as technology, where most of the corporate value lies in future growth. On the other hand, Value stocks are common in sectors such as energy and financials, where a greater portion of value lies in today’s earnings. As bond yields rise, future growth is discounted more heavily as we saw at the start of the year, when Growth stocks de-rated more heavily and Value stocks
outperformed. This trend reversed recently as bond yields retreated from their highs. However, we expect bond yields to stay elevated over the next 12 months, supporting the outperformance of sectors such as financials. The weakness of energy equities due to recession fears are also overdone, in our view. We see energy equities trading at a significant discount to the market and undervalued at current oil prices. Tight supplies are likely to keep oil prices stable or higher, supporting energy sector equities’ outperformance over the next 6-12 months, in our view.
In terms of regions, we continue to prefer Asia ex-Japan. Valuation and earnings expectations continue to be depressed, with China companies expected to grow at 2.0% y/y in 2022 earnings, down from 13% expected at the start of the year. Chinese authorities continue to give strong policy support to the economy to offset the fall in local government revenues due to the slowdown in the property sector. The authorities also appear to be less stringent in their COVID-19 lockdowns, despite another rise in the number of infections due to the new Omicron variant.
FX – at a glance
|
|
||||
Key themes
Our 6-12-month USD view remains bearish. We expect the USD to peak in H2 22 as i) Fed policy expectations reach peak hawkishness as growth eases along with inflation data; ii) global central banks, including possibly the BoJ at a later stage, normalise monetary policy to temper currency weakness that amplifies inflation; iii) capital flows rotate away from the US seeking better valuations; iv) steady de-dollarisation continues; and v) uncertainty rises around US politics and the future policy direction. The USD has already priced in significant Fed hikes, slower global growth and considerable safe-haven risk. The USD downside reversal may gain traction as global monetary policy increasingly converges, China’s growth worries start to ease, energy supply concerns subside and some kind of de-escalation starts in Ukraine.
Key risks that could trigger further USD strength include: i) a rebound in US household and business confidence and credit expansion, ii) further global economic weakness that improves the relative allure of US assets, and iii) a further decline in global risk sentiment as political and geopolitical tensions rise. Europe appears to be facing stronger headwinds in the near term, and we expect commodity currencies to lead the challenge to the USD, underpinned by hawkish central banks, attractive valuations and strong fundamentals. The JPY remains heavily oversold and undervalued and could see sharp gains if US rates slide.
Technicals suggest the USD index (DXY) may have peaked around 109.30 earlier this month. While we would not rule out another USD high as yet, a break below key support (for DXY) around 105.75 would add confidence that the USD downtrend can accelerate towards 103.70 initially, and then 102.
Key chart
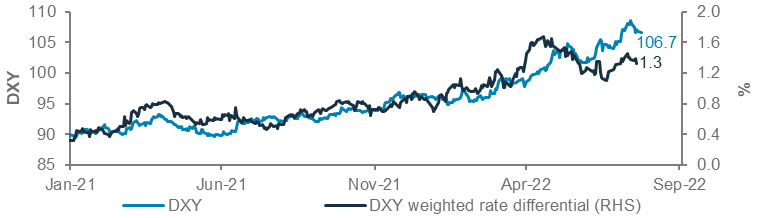
The USD has outpaced interest rate differentials and now has a sizeable safe-haven buffer priced in. The USD may also have completed a typical end-of-trend overshoot. Rising convergence in global monetary policy outlook may trigger a USD reversal
Fig. 13 Fig. 13 Interest rate differentials have started to turn, supporting a weaker USD
USD index (DXY), DXY-weighted inflation-adjusted 10-year yield differentials vs US
A leg lower in the USD?
Long-term fundamentals continue to imply a weaker USD as the greenback is overvalued on many fundamental valuation models. However, near-term USD downside risk is likely capped by strong headwinds for the EUR and the GBP. Although the ECB hiked rates by 50bps last week and ended an era of negative rates, the EUR rally has been lacklustre. As long as headwinds from high inflation, slowing growth, acute energy supply concerns and political uncertainty in Italy continue to play out, the EUR could test parity again and potentially extend to new lows around 0.98.
The ECB has implied indirectly that further rate hikes would be preferred to stabilise the EUR, but economic growth data raise doubts whether the economy can withstand further hikes near-term. The newly announced Transmission Protection Instrument (TPI) also remains unproven in its ability to contain pan-European bond yields.
The GBP also faces headwinds from inflation and weak growth, besides political uncertainty until a new prime minister is chosen. The new leader will then need to confront the challenges of post-Brexit EU relations and calls for a Scottish independence vote. A re-test of the 1.1760 low is possible before a long-term rally towards 1.2700.
USD/JPY has pulled back from its peak around 139.40 despite the BoJ keeping policy unchanged. The JPY may be regaining its traditional safe-haven properties, and is extremely undervalued and oversold, but it would likely require a less hawkish Fed pivot to trigger a deep correction below 134 towards 130, and then 126.
AUD/USD has rallied strongly following a deep dive below 0.6700, and a break above 0.7055 would be a bullish signal for a further climb towards 0.7300. USD/CAD likely completed a ’capitulation rally‘ above 1.3200 in July. We look for a break below 1.2750 to support a deeper drop towards 1.2500.
Gold, crude oil – at a glance
|
|
||||
Key themes
We continue to favour gold as we believe it remains a key portfolio diversifier. Although gold prices have come under recent pressure from higher bond yields, a stronger USD and net investment outflows, we believe that adding to gold at current levels is attractive. Gold has given up much of its early-year gains as investors have reduced positioning to offset losses and risk positions. As we expect a weaker USD over a 6-12-month horizon, we see scope for investors to rebuild their long positions in the precious metal, especially given the extremely net-short investor positioning.
We remain bullish on oil prices as global oil supplies remain tight. Following the tweak to the EU embargo policy, which allowed Russia to export oil to third countries, coupled with fears of a slowdown in growth, oil prices closed lower for three consecutive weeks. However, we believe that the risk of Russia reducing gas supplies via the Nord Stream 1 pipeline remains high; other key headwinds such as low oil inventory and OPEC+ supply capacity constraints pose upside risks for oil.
Key chart
At current levels, we see gold offering an attractive hedge against geopolitical risk; a weaker USD would be a key tailwind for the precious metal
A possible cut in Russian gas supply and OPEC+ capacity constraints pose significant upside risk for oil
Fig. 14 A strong USD has been a drag on gold recently, but a peaking USD supports our preference for gold; widening spreads indicate oil markets remain tight
LHS chart: Gold vs USD Index (DXY)
RHS chart: WTI front month vs first-to-third calendar spread (1m-3m price)
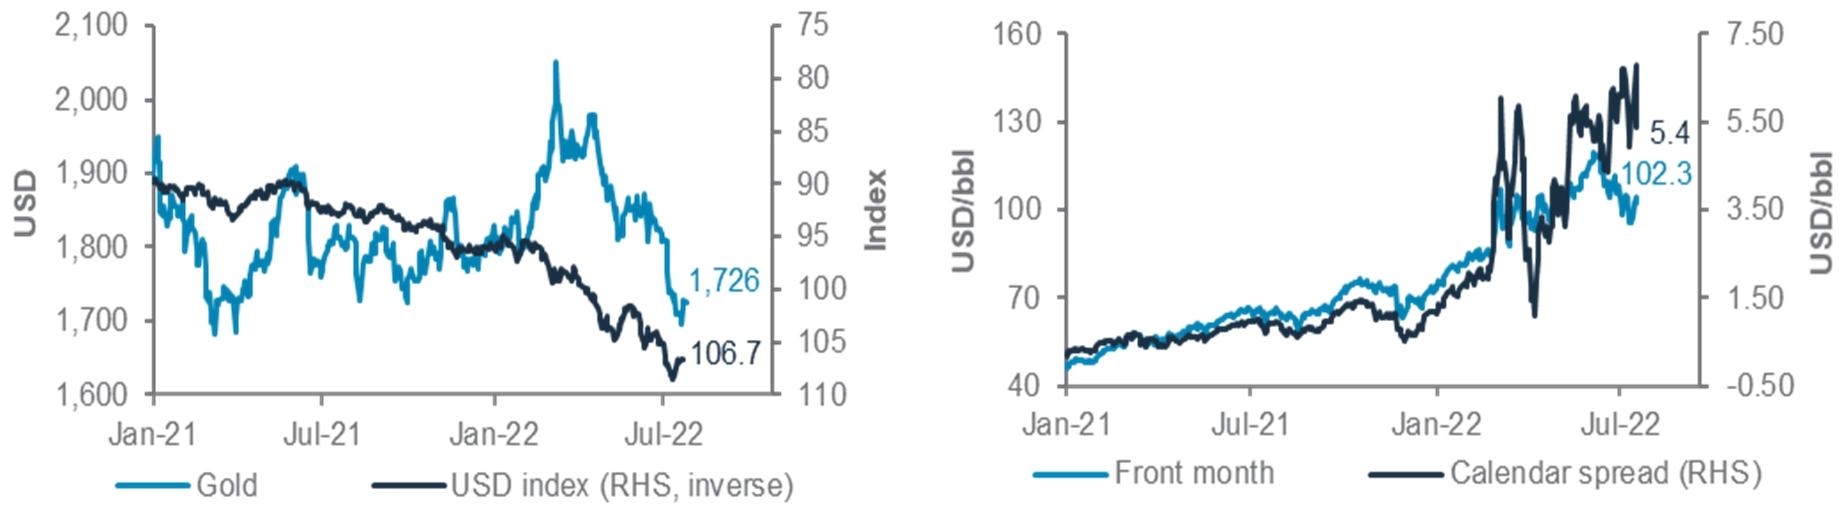
Will gold shine again?
Over the recent months, gold has been battered by key headwinds such as rising interest rates, a stronger USD and net outflows from money managers.
Looking back at history, gold tends to do well during bouts of equity volatility, but trends lower over an extended period as safe-haven demand remains short-lived. We believe gold can rebound strongly as geopolitical tensions remain high, an aggressive Fed hiking cycle is likely priced in and the USD broadly weakens over a 12-month horizon.
Over a shorter horizon, positioning for gold is extremely short as investors have scaled back exposure, raising the potential for a reversal. Physical demand for gold continues to hold, and dips below USD 1,700/oz have been short-lived. Hence, as long as key support of USD 1,680/oz holds, we would expect investors to be buyers of gold on dips.
What is the outlook for oil?
Oil prices have been on a decline over the past few weeks, closing below USD 100/bbl recently, as recession fears and an easing of the EU embargo policy to allow Russian exports to third countries partly eased some supply constraints. However, oil prices are likely to remain elevated as tight supply could outweigh the decline in demand, in our view.
Earlier this month, OPEC forecast that output would need to reach 30.1m/bpd in 2023 to balance the global demand-supply, an increase of 900k bpd from 2022. This seems difficult, in our view, as OPEC+ is already struggling with capacity constraints. In the US, shale producers continued their cautious approach to production growth, while a Russian disruption of energy supply to Europe remains a risk. Hence, we remain constructive on oil prices, barring a deep recession that leads to significant demand destruction.
Quant perspective
US market risk model – bullish bond
|
Bullish bond markets, still bearish equities
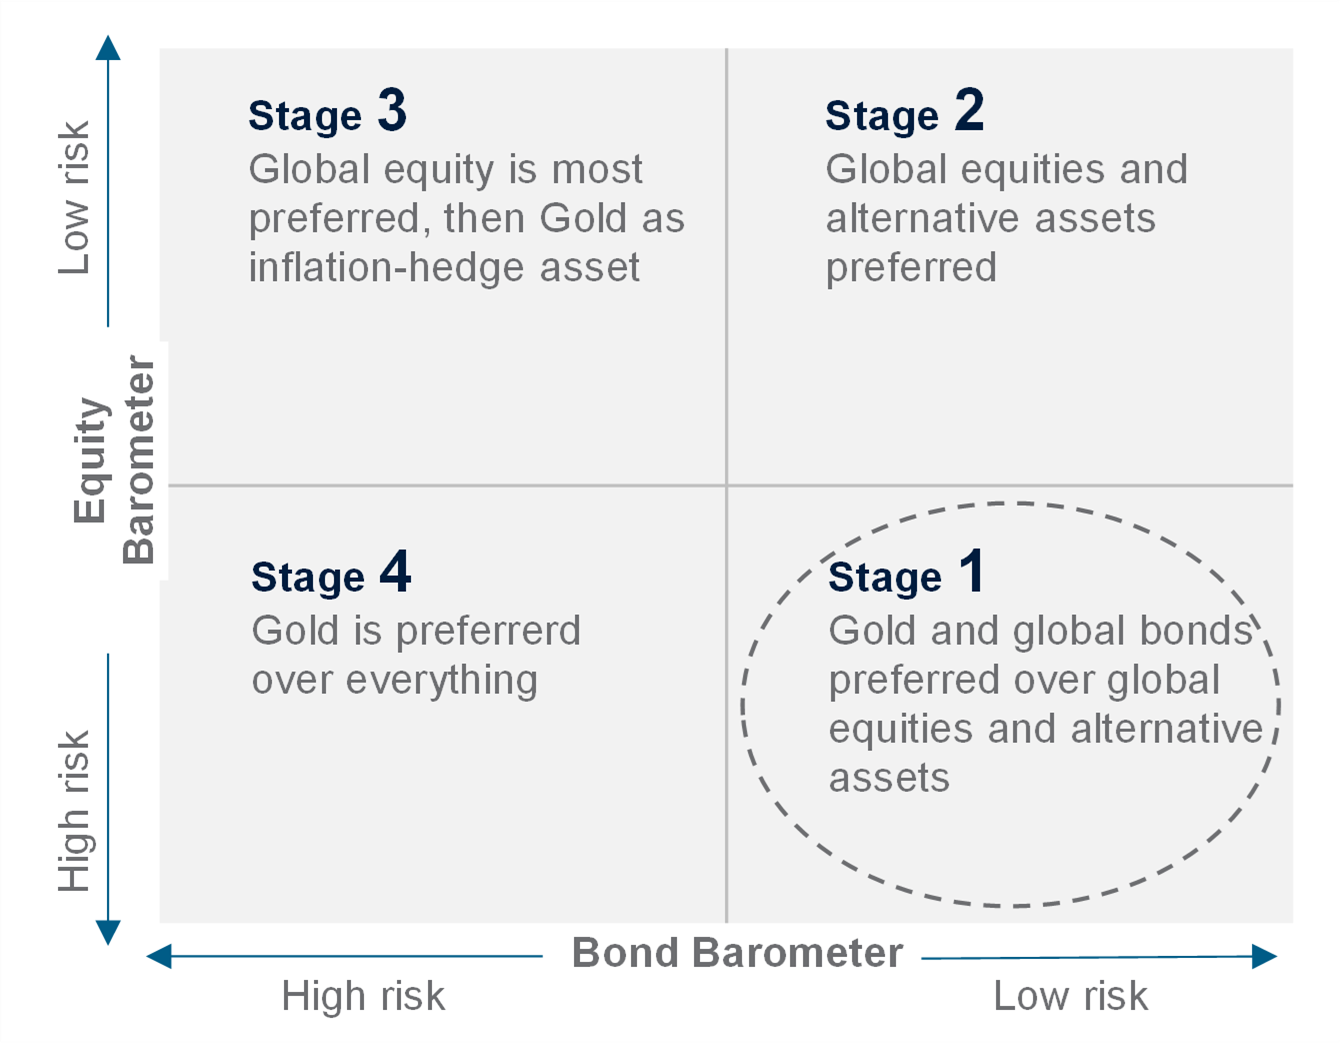
Our US Equity-Bond Market Risk (EBMR) models the downside risks in US equities and the US 10-year government bonds. It uses 11 economic and market factors to create equity and bond risk barometers. If the value of a barometer falls below 50, it signals higher downside risks and vice versa.
The US EBMR model finally moved into Stage 1 in July as the bond barometer turned bullish for the first time since August 2020, while the equity barometer remains bearish. The still-bearish equity barometer implies downside risk remains despite the recent recovery in S&P 500. Meanwhile, the bond barometer has captured c.2.1% rise in the US 10-year government bond yield since August 2020 (bond price falls as yield rises) after a series of rate hikes. The model’s switch in July implies the worst may be over for bond markets.
Fig. 15 EBMR turned bullish on bond market risks
US equity and bond market risk barometers
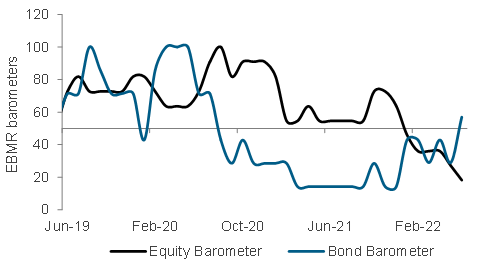
The equity barometer consists of 11 equity indicators. In July, the barometer dropped to a low 18 from 27 as most equity signals are now against taking equity market risks. The deterioration in the already bearish barometer is due to the recent dip in US housing starts, which is part of the growth risk we have cautioned about last month. Along with the higher interest rates this year, reduction of liquidity and elevated inflation, the equity barometer could stay bearish for longer in the coming months.
The bond barometer, which tracks six bond indicators, has turned bullish for the first time since August 2020, after jumping to 57 from 29 in July. The shift is driven by the negative momentum in the CRB Raw Industrials Index, as it is a counter signal to growth and inflation and favours bonds over equities. Meanwhile, the recent deterioration in housing starts and jobless claims have yet to turn into positive signals for the bond barometer, but a continued slowdown in growth outlook could start to see these factors turn supportive as well.
The model’s projections are now skewed towards a recession scenario for the remaining months in 2022. This implies US equities could continue to face higher downside risk, and high-duration bonds could start to reverse their downward trend since August 2020.
Implications on global assets
Data since 1999 suggest gold and bonds are the most preferred in Stage 1. The model’s preference for the asset is based on its long-term relationship with the market cycle, which favours gold and bonds as defensive assets in Stage 1.
Fig. 16 Scenarios over the upcoming months till October 2022 vs December 2021 (Outlook 2022) projections
Probability of the evolution of financial market risk cycle from the current Stage 1 and preferred assets
Model’s estimated probabilities in December 2021
| Stage | Dec-21 | Jan-22 | Feb-22 | Mar-22 |
|---|---|---|---|---|
| 1 | 0% | 0% | 0% | 0% |
| 2 | 0% | 0% | 0% | 0% |
| 3 | 100% | 100% | 100% | 99% |
| 4 | 0% | 0% | 0% | 0% |
Model’s estimated probabilities in June 2022
| Stage | Jul-22 | Aug-22 | Sep-22 | Oct-22 |
|---|---|---|---|---|
| 1 | 96% | 81% | 57% | 53% |
| 2 | 0% | 6% | 41% | 45% |
| 3 | 0% | 3% | 1% | 1% |
| 4 | 4% | 9% | 1% | 0% |
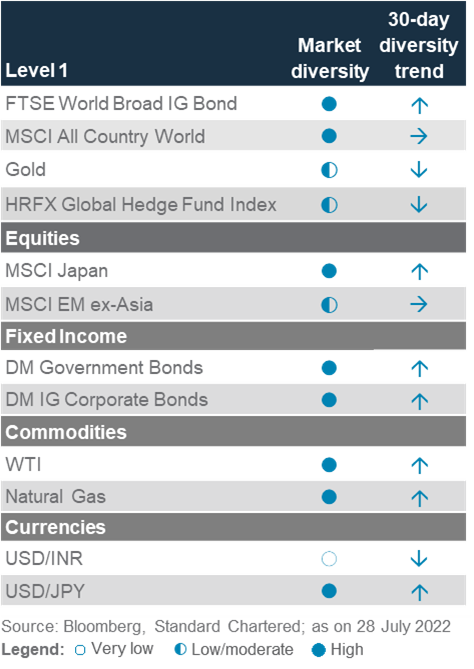
Tracking market diversity
|
About our market diversity indicators
Our market diversity indicators help to identify a potential change in short-term trends due to a fall in market breadth across equities, credit, FX and commodities. When market diversity falls, it implies either buyers or sellers are dominating, leading to a rapid rise or fall in asset prices. This is usually unsustainable and is likely to be followed by a slowdown or a reversal. Our diversity indicator is based on a statistical index called fractal dimension; a value below 1.25 serves as a guideline that prices are rising or falling too fast.
Where is diversity falling or rising this month?
General market diversity has improved across equity, bond and currency markets. None of the equity and bond markets we track have diversity below our reversal threshold this month. In FX, only USD/INR is being flagged for a reversal (after a c.7.3% gain YTD) as the USD has not corrected against the INR as it did with other major currencies.
In equities, we previously flagged potentially oversold conditions in Japan and EM ex-Asia, while other equity markets lack such reversal signals due to elevated volatility. With this month’s update, diversity of both Japan (+4.4% MTD) and EM ex-Asia (+3.1% MTD) have moved back above the trigger level of 1.25 as their sell-off took a short pause.
Fig. 17 Average market diversity score by asset class
Diversity improved across key asset classes
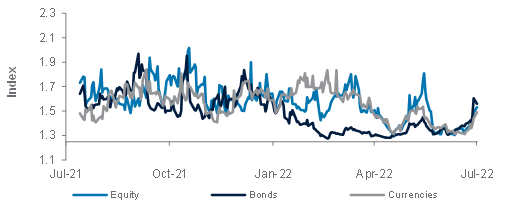
Fig. 18 Percentage of assets with diversity score <1.25
Red flags fell across key asset classes
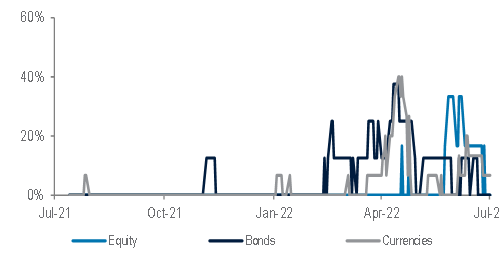
Interestingly, the diversity of bond markets has improved significantly as our US EBMR model also started to turn bullish on US government bond market risk. This includes DM government bonds, which have remained below our diversity threshold of 1.25 since May. The improvement in diversity of bond markets in general has coincided with the recent reversal in US 10-year government bond yields. However, we caution against taking excessive exposure in bonds over the short term as monetary policy remains a key driver and an uncertainty for bond market performance.
Fig. 19 Diversity across key assets
Performance Review
Foundation: Asset allocation summary
Market performance summary
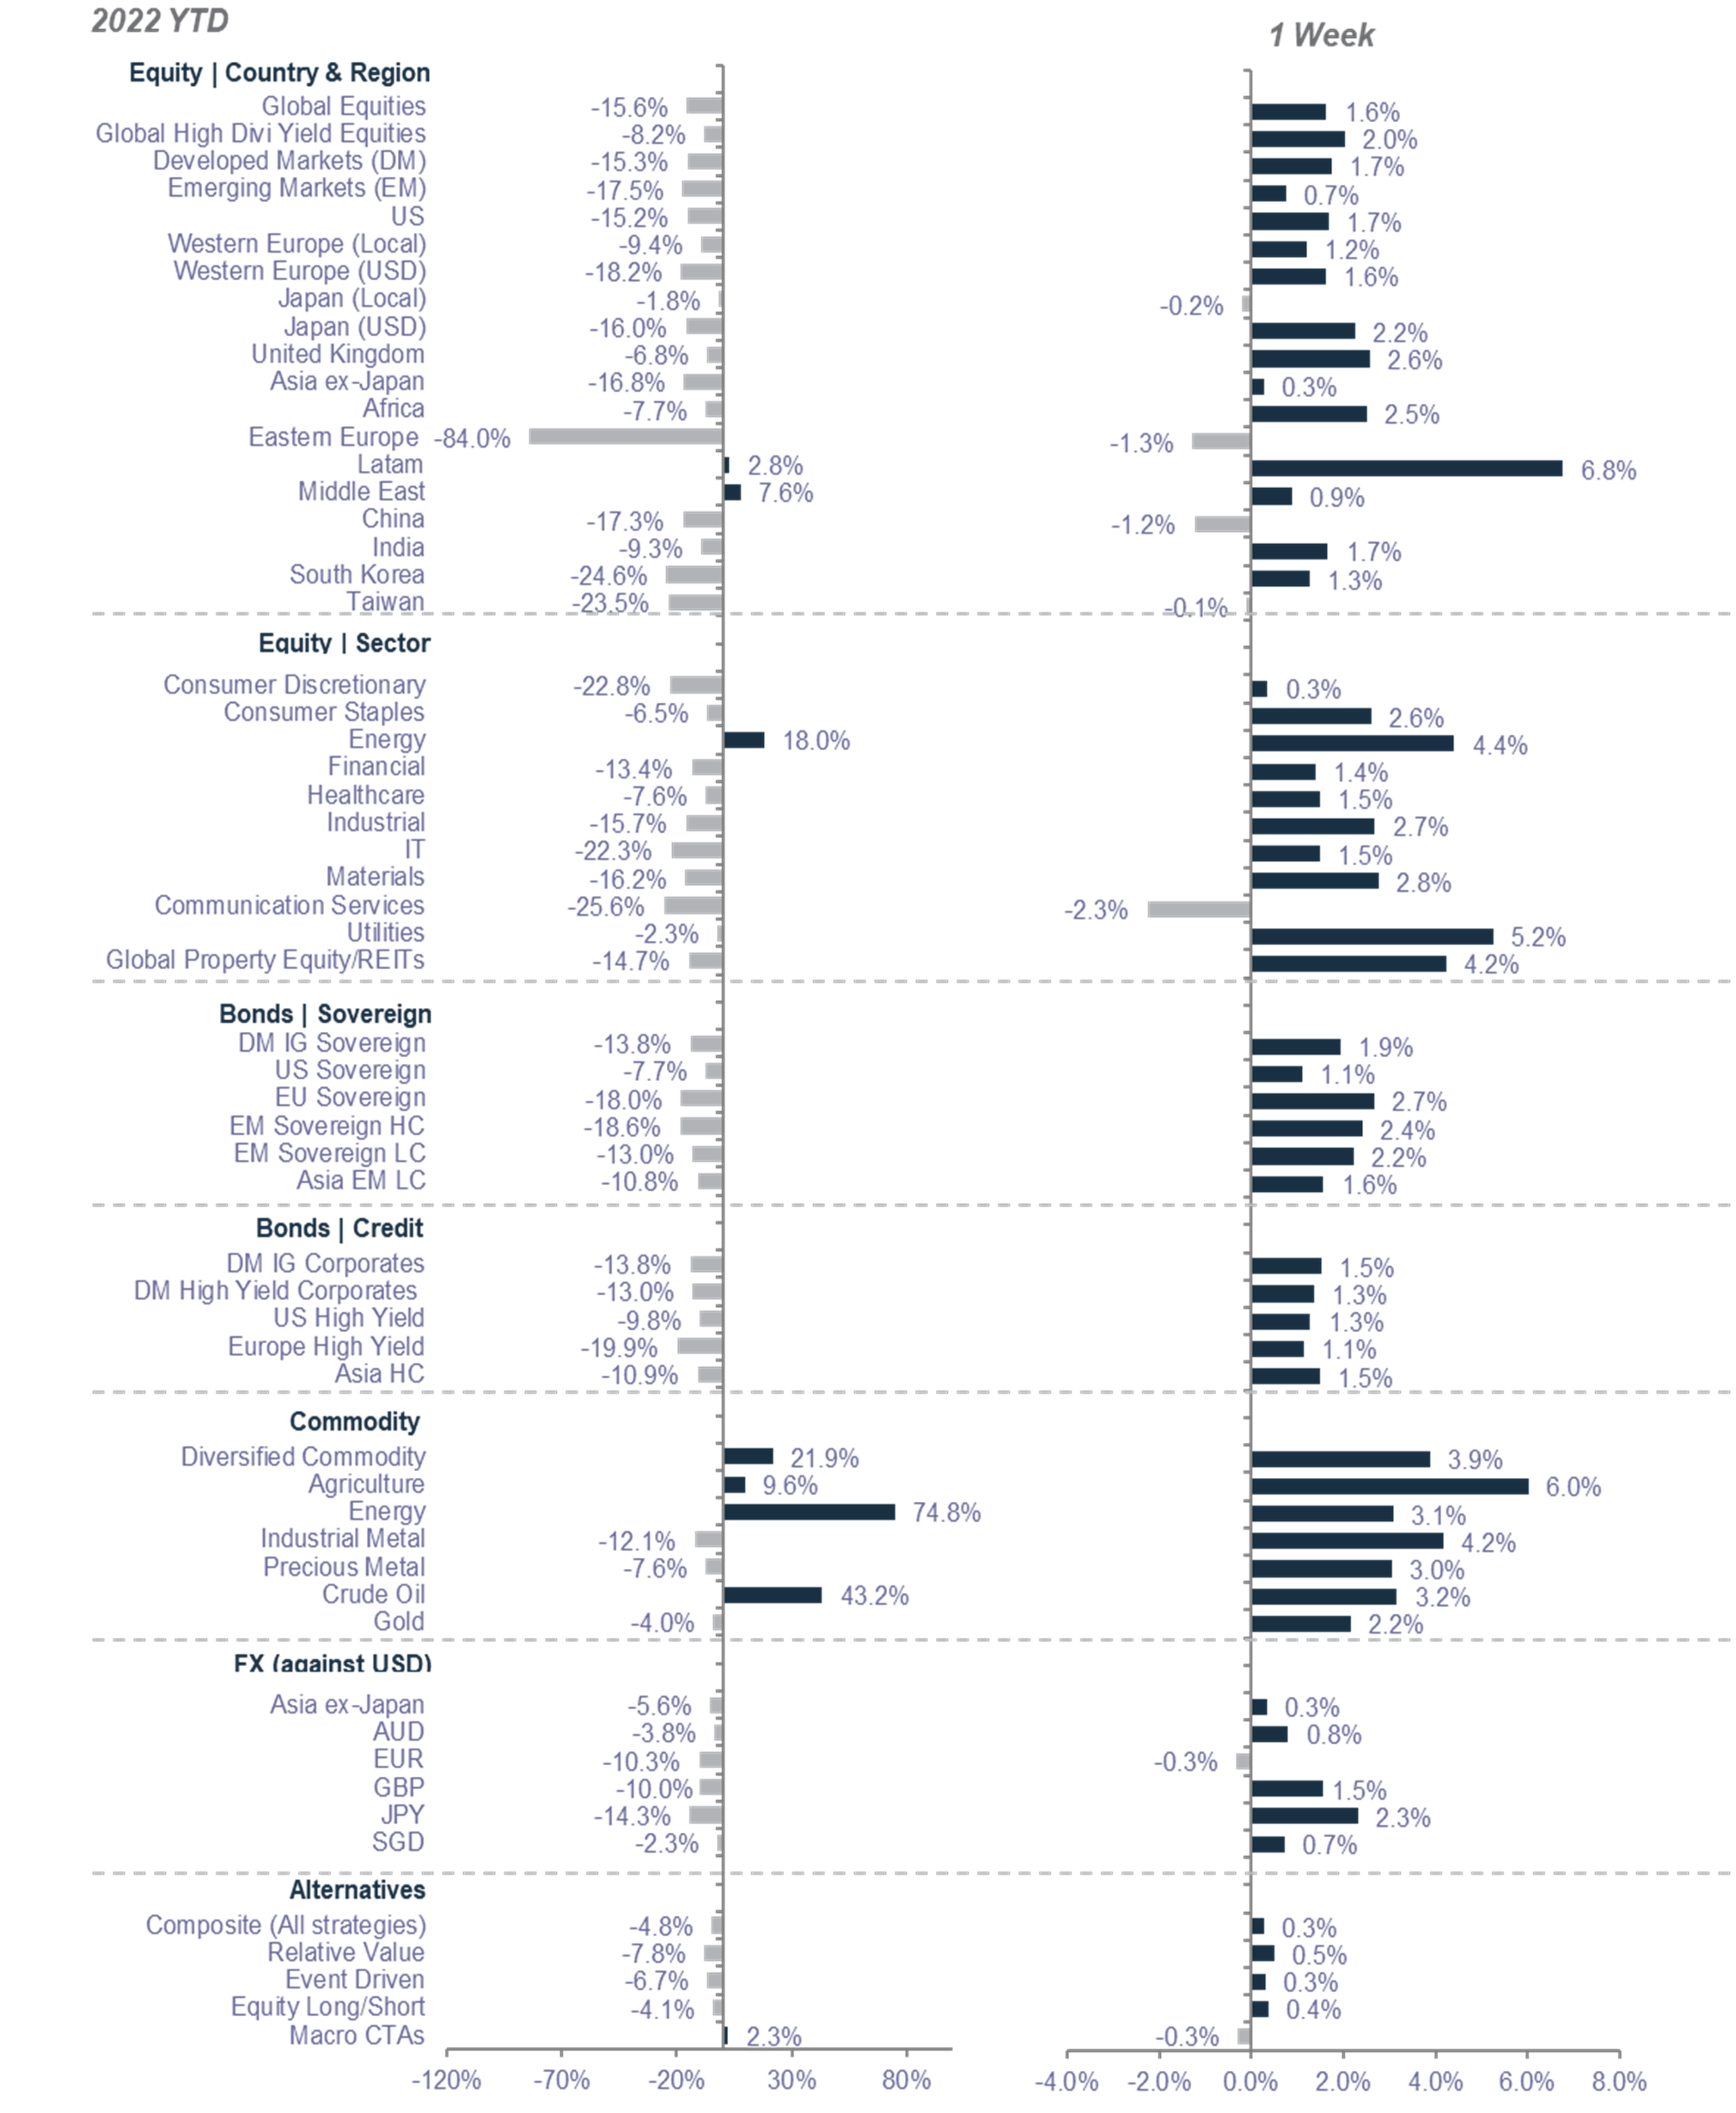
Source: MSCI, JPMorgan, Citigroup, Dow Jones, HFRX, FTSE, Bloomberg, Standard Chartered
*All performance shown in USD terms, unless otherwise stated
*YTD performance data from 31 December 2021 to 28 July 2022 and 1 week-performance from 21 July 2022 to 28 July 2022
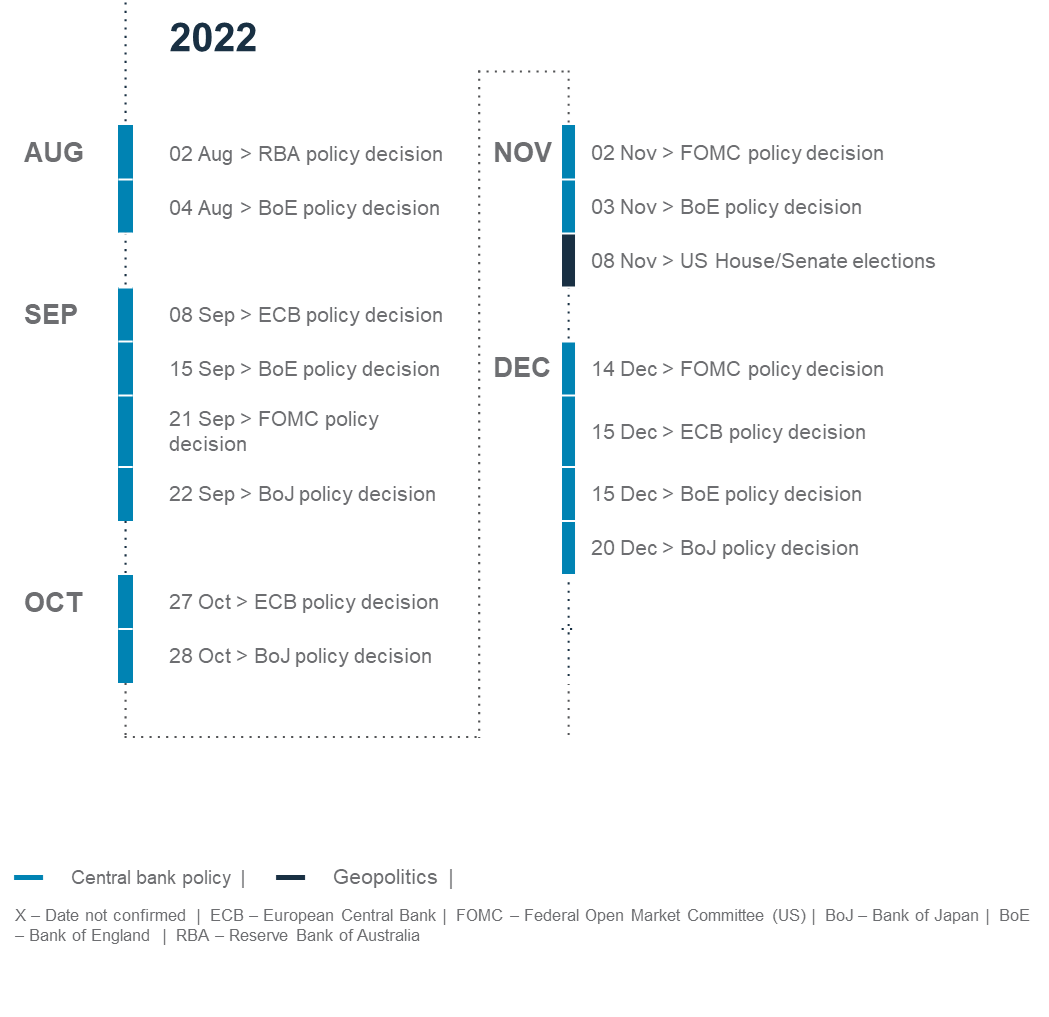
Key events
For more insights

Explanatory notes
1. The figures on page 5 show allocations for a moderate risk profile only – different risk profiles may produce significantly different asset allocation results. Page 5 is only an example, provided for general information only and they do not constitute investment advice, an offer, recommendation or solicitation. They do not take into account the specific investment objectives, needs or risk tolerances of a particular person or class of persons and they have not been prepared for any particular person or class of persons.
2. Contingent Convertibles are complex financial instruments and are not a suitable or appropriate investment for all investors. This document is not an offer to sell or an invitation to buy any securities or any beneficial interests therein. Contingent convertible securities are not intended to be sold and should not be sold to retail clients in the European Economic Area (EEA) (each as defined in the Policy Statement on the Restrictions on the Retail Distribution of Regulatory Capital Instruments (Feedback to CP14/23 and Final Rules) (“Policy Statement”), read together with the Product Intervention (Contingent Convertible Instruments and Mutual Society Shares) Instrument 2015 (“Instrument”, and together with the Policy Statement, the “Permanent Marketing Restrictions”), which were published by the United Kingdom’s Financial Conduct Authority in June 2015), other than in circumstances that do not give rise to a contravention of the Permanent Marketing Restrictions.
Disclosure
This document is confidential and may also be privileged. If you are not the intended recipient, please destroy all copies and notify the sender immediately. This document is being distributed for general information only and is subject to the relevant disclaimers available at our Standard Chartered website under Regulatory disclosures. It is not and does not constitute research material, independent research, an offer, recommendation or solicitation to enter into any transaction or adopt any hedging, trading or investment strategy, in relation to any securities or other financial instruments. This document is for general evaluation only. It does not take into account the specific investment objectives, financial situation or particular needs of any particular person or class of persons and it has not been prepared for any particular person or class of persons. You should not rely on any contents of this document in making any investment decisions. Before making any investment, you should carefully read the relevant offering documents and seek independent legal, tax and regulatory advice. In particular, we recommend you to seek advice regarding the suitability of the investment product, taking into account your specific investment objectives, financial situation or particular needs, before you make a commitment to purchase the investment product. Opinions, projections and estimates are solely those of SC at the date of this document and subject to change without notice. Past performance is not indicative of future results and no representation or warranty is made regarding future performance. The value of investments, and the income from them, can go down as well as up, and you may not recover the amount of your original investment. You are not certain to make a profit and may lose money. Any forecast contained herein as to likely future movements in rates or prices or likely future events or occurrences constitutes an opinion only and is not indicative of actual future movements in rates or prices or actual future events or occurrences (as the case may be). This document must not be forwarded or otherwise made available to any other person without the express written consent of the Standard Chartered Group (as defined below). Standard Chartered Bank is incorporated in England with limited liability by Royal Charter 1853 Reference Number ZC18. The Principal Office of the Company is situated in England at 1 Basinghall Avenue, London, EC2V 5DD. Standard Chartered Bank is authorised by the Prudential Regulation Authority and regulated by the Financial Conduct Authority and Prudential Regulation Authority. Standard Chartered PLC, the ultimate parent company of Standard Chartered Bank, together with its subsidiaries and affiliates (including each branch or representative office), form the Standard Chartered Group. Standard Chartered Private Bank is the private banking division of Standard Chartered. Private banking activities may be carried out internationally by different legal entities and affiliates within the Standard Chartered Group (each an “SC Group Entity”) according to local regulatory requirements. Not all products and services are provided by all branches, subsidiaries and affiliates within the Standard Chartered Group. Some of the SC Group Entities only act as representatives of Standard Chartered Private Bank and may not be able to offer products and services or offer advice to clients.
Copyright © 2025, Accounting Research & Analytics, LLC d/b/a CFRA (and its affiliates, as applicable). Reproduction of content provided by CFRA in any form is prohibited except with the prior written permission of CFRA. CFRA content is not investment advice and a reference to or observation concerning a security or investment provided in the CFRA SERVICES is not a recommendation to buy, sell or hold such investment or security or make any other investment decisions. The CFRA content contains opinions of CFRA based upon publicly-available information that CFRA believes to be reliable and the opinions are subject to change without notice. This analysis has not been submitted to, nor received approval from, the United States Securities and Exchange Commission or any other regulatory body. While CFRA exercised due care in compiling this analysis, CFRA, ITS THIRD-PARTY SUPPLIERS, AND ALL RELATED ENTITIES SPECIFICALLY DISCLAIM ALL WARRANTIES, EXPRESS OR IMPLIED, INCLUDING, BUT NOT LIMITED TO, ANY WARRANTIES OF MERCHANTABILITY OR FITNESS FOR A PARTICULAR PURPOSE OR USE, to the full extent permitted by law, regarding the accuracy, completeness, or usefulness of this information and assumes no liability with respect to the consequences of relying on this information for investment or other purposes. No content provided by CFRA (including ratings, credit-related analyses and data, valuations, model, software or other application or output therefrom) or any part thereof may be modified, reverse engineered, reproduced or distributed in any form by any means, or stored in a database or retrieval system, without the prior written permission of CFRA, and such content shall not be used for any unlawful or unauthorized purposes. CFRA and any third-party providers, as well as their directors, officers, shareholders, employees or agents do not guarantee the accuracy, completeness, timeliness or availability of such content. In no event shall CFRA, its affiliates, or their third-party suppliers be liable for any direct, indirect, special, or consequential damages, costs, expenses, legal fees, or losses (including lost income or lost profit and opportunity costs) in connection with a subscriber’s, subscriber’s customer’s, or other’s use of CFRA’s content.
Market Abuse Regulation (MAR) Disclaimer
Banking activities may be carried out internationally by different branches, subsidiaries and affiliates within the Standard Chartered Group according to local regulatory requirements. Opinions may contain outright “buy”, “sell”, “hold” or other opinions. The time horizon of this opinion is dependent on prevailing market conditions and there is no planned frequency for updates to the opinion. This opinion is not independent of Standard Chartered Group’s trading strategies or positions. Standard Chartered Group and/or its affiliates or its respective officers, directors, employee benefit programmes or employees, including persons involved in the preparation or issuance of this document may at any time, to the extent permitted by applicable law and/or regulation, be long or short any securities or financial instruments referred to in this document or have material interest in any such securities or related investments. Therefore, it is possible, and you should assume, that Standard Chartered Group has a material interest in one or more of the financial instruments mentioned herein. Please refer to our Standard Chartered website under Regulatory disclosures for more detailed disclosures, including past opinions/ recommendations in the last 12 months and conflict of interests, as well as disclaimers. A covering strategist may have a financial interest in the debt or equity securities of this company/issuer. All covering strategist are licensed to provide investment recommendations under Monetary Authority of Singapore or Hong Kong Monetary Authority. This document must not be forwarded or otherwise made available to any other person without the express written consent of Standard Chartered Group.
Sustainable Investments
Any ESG data used or referred to has been provided by Morningstar, Sustainalytics, MSCI or Bloomberg. Refer to 1) Morningstar website under Sustainable Investing, 2) Sustainalytics website under ESG Risk Ratings, 3) MCSI website under ESG Business Involvement Screening Research and 4) Bloomberg green, social & sustainability bonds guide for more information. The ESG data is as at the date of publication based on data provided, is for informational purpose only and is not warranted to be complete, timely, accurate or suitable for a particular purpose, and it may be subject to change. Sustainable Investments (SI): This refers to funds that have been classified as ‘Sustainable Investments’ by Morningstar. SI funds have explicitly stated in their prospectus and regulatory filings that they either incorporate ESG factors into the investment process or have a thematic focus on the environment, gender diversity, low carbon, renewable energy, water or community development. For equity, it refers to shares/stocks issued by companies with Sustainalytics ESG Risk Rating of Low/Negligible. For bonds, it refers to debt instruments issued by issuers with Sustainalytics ESG Risk Rating of Low/Negligible, and/or those being certified green, social, sustainable bonds by Bloomberg. For structured products, it refers to products that are issued by any issuer who has a Sustainable Finance framework that aligns with Standard Chartered’s Green and Sustainable Product Framework, with underlying assets that are part of the Sustainable Investment universe or separately approved by Standard Chartered’s Sustainable Finance Governance Committee. Sustainalytics ESG risk ratings shown are factual and are not an indicator that the product is classified or marketed as “green”, “sustainable” or similar under any particular classification system or framework.
Country/Market Specific Disclosures
Botswana: This document is being distributed in Botswana by, and is attributable to, Standard Chartered Bank Botswana Limited which is a financial institution licensed under the Section 6 of the Banking Act CAP 46.04 and is listed in the Botswana Stock Exchange. Brunei Darussalam: This document is being distributed in Brunei Darussalam by, and is attributable to, Standard Chartered Bank (Brunei Branch) | Registration Number RFC/61 and Standard Chartered Securities (B) Sdn Bhd | Registration Number RC20001003. Standard Chartered Bank is incorporated in England with limited liability by Royal Charter 1853 Reference Number ZC18. Standard Chartered Securities (B) Sdn Bhd is a limited liability company registered with the Registry of Companies with Registration Number RC20001003 and licensed by Brunei Darussalam Central Bank as a Capital Markets Service License Holder with License Number BDCB/R/CMU/S3-CL and it is authorised to conduct Islamic investment business through an Islamic window. China Mainland: This document is being distributed in China by, and is attributable to, Standard Chartered Bank (China) Limited which is mainly regulated by National Financial Regulatory Administration (NFRA), State Administration of Foreign Exchange (SAFE), and People’s Bank of China (PBOC). Hong Kong: In Hong Kong, this document, except for any portion advising on or facilitating any decision on futures contracts trading, is distributed by Standard Chartered Bank (Hong Kong) Limited (“SCBHK”), a subsidiary of Standard Chartered PLC. SCBHK has its registered address at 32/F, Standard Chartered Bank Building, 4-4A Des Voeux Road Central, Hong Kong and is regulated by the Hong Kong Monetary Authority and registered with the Securities and Futures Commission (“SFC”) to carry on Type 1 (dealing in securities), Type 4 (advising on securities), Type 6 (advising on corporate finance) and Type 9 (asset management) regulated activity under the Securities and Futures Ordinance (Cap. 571) (“SFO”) (CE No. AJI614). The contents of this document have not been reviewed by any regulatory authority in Hong Kong and you are advised to exercise caution in relation to any offer set out herein. If you are in doubt about any of the contents of this document, you should obtain independent professional advice. Any product named herein may not be offered or sold in Hong Kong by means of any document at any time other than to “professional investors” as defined in the SFO and any rules made under that ordinance. In addition, this document may not be issued or possessed for the purposes of issue, whether in Hong Kong or elsewhere, and any interests may not be disposed of, to any person unless such person is outside Hong Kong or is a “professional investor” as defined in the SFO and any rules made under that ordinance, or as otherwise may be permitted by that ordinance. In Hong Kong, Standard Chartered Private Bank is the private banking division of SCBHK, a subsidiary of Standard Chartered PLC. Ghana: Standard Chartered Bank Ghana Limited accepts no liability and will not be liable for any loss or damage arising directly or indirectly (including special, incidental or consequential loss or damage) from your use of these documents. Past performance is not indicative of future results and no representation or warranty is made regarding future performance. You should seek advice from a financial adviser on the suitability of an investment for you, taking into account these factors before making a commitment to invest in an investment. To unsubscribe from receiving further updates, please send an email to feedback.ghana@sc.com. Please do not reply to this email. Call our Priority Banking on 0302610750 for any questions or service queries. You are advised not to send any confidential and/or important information to Standard Chartered via e-mail, as Standard Chartered makes no representations or warranties as to the security or accuracy of any information transmitted via e-mail. Standard Chartered shall not be responsible for any loss or damage suffered by you arising from your decision to use e-mail to communicate with the Bank. India: This document is being distributed in India by Standard Chartered in its capacity as a distributor of mutual funds and referrer of any other third party financial products. Standard Chartered does not offer any ‘Investment Advice’ as defined in the Securities and Exchange Board of India (Investment Advisers) Regulations, 2013 or otherwise. Services/products related securities business offered by Standard Charted are not intended for any person, who is a resident of any jurisdiction, the laws of which imposes prohibition on soliciting the securities business in that jurisdiction without going through the registration requirements and/or prohibit the use of any information contained in this document. Indonesia: This document is being distributed in Indonesia by Standard Chartered Bank, Indonesia branch, which is a financial institution licensed and supervised by Otoritas Jasa Keuangan (Financial Service Authority) and Bank Indonesia. Jersey: In Jersey, Standard Chartered Private Bank is the Registered Business Name of the Jersey Branch of Standard Chartered Bank. The Jersey Branch of Standard Chartered Bank is regulated by the Jersey Financial Services Commission. Copies of the latest audited accounts of Standard Chartered Bank are available from its principal place of business in Jersey: PO Box 80, 15 Castle Street, St Helier, Jersey JE4 8PT. Standard Chartered Bank is incorporated in England with limited liability by Royal Charter in 1853 Reference Number ZC 18. The Principal Office of the Company is situated in England at 1 Basinghall Avenue, London, EC2V 5DD. Standard Chartered Bank is authorised by the Prudential Regulation Authority and regulated by the Financial Conduct Authority and Prudential Regulation Authority. The Jersey Branch of Standard Chartered Bank is also an authorised financial services provider under license number 44946 issued by the Financial Sector Conduct Authority of the Republic of South Africa. Jersey is not part of the United Kingdom and all business transacted with Standard Chartered Bank, Jersey Branch and other SC Group Entity outside of the United Kingdom, are not subject to some or any of the investor protection and compensation schemes available under United Kingdom law. Kenya: This document is being distributed in Kenya by and is attributable to Standard Chartered Bank Kenya Limited. Investment Products and Services are distributed by Standard Chartered Investment Services Limited, a wholly owned subsidiary of Standard Chartered Bank Kenya Limited that is licensed by the Capital Markets Authority in Kenya, as a Fund Manager. Standard Chartered Bank Kenya Limited is regulated by the Central Bank of Kenya. Malaysia: This document is being distributed in Malaysia by Standard Chartered Bank Malaysia Berhad (“SCBMB”). Recipients in Malaysia should contact SCBMB in relation to any matters arising from, or in connection with, this document. This document has not been reviewed by the Securities Commission Malaysia. The product lodgement, registration, submission or approval by the Securities Commission of Malaysia does not amount to nor indicate recommendation or endorsement of the product, service or promotional activity. Investment products are not deposits and are not obligations of, not guaranteed by, and not protected by SCBMB or any of the affiliates or subsidiaries, or by Perbadanan Insurans Deposit Malaysia, any government or insurance agency. Investment products are subject to investment risks, including the possible loss of the principal amount invested. SCBMB expressly disclaim any liability and responsibility for any loss arising directly or indirectly (including special, incidental or consequential loss or damage) arising from the financial losses of the Investment Products due to market condition. Nigeria: This document is being distributed in Nigeria by Standard Chartered Bank Nigeria Limited (SCB Nigeria), a bank duly licensed and regulated by the Central Bank of Nigeria. SCB Nigeria accepts no liability for any loss or damage arising directly or indirectly (including special, incidental or consequential loss or damage) from your use of these documents. You should seek advice from a financial adviser on the suitability of an investment for you, taking into account these factors before making a commitment to invest in an investment. To unsubscribe from receiving further updates, please send an email to clientcare.ng@sc.com requesting to be removed from our mailing list. Please do not reply to this email. Call our Priority Banking on 02 012772514 for any questions or service queries. SCB Nigeria shall not be responsible for any loss or damage arising from your decision to send confidential and/or important information to Standard Chartered via e-mail. SCB Nigeria makes no representations or warranties as to the security or accuracy of any information transmitted via e-mail. Pakistan: This document is being distributed in Pakistan by, and attributable to Standard Chartered Bank (Pakistan) Limited having its registered office at PO Box 5556, I.I Chundrigar Road Karachi, which is a banking company registered with State Bank of Pakistan under Banking Companies Ordinance 1962 and is also having licensed issued by Securities & Exchange Commission of Pakistan for Security Advisors. Standard Chartered Bank (Pakistan) Limited acts as a distributor of mutual funds and referrer of other third-party financial products. Singapore: This document is being distributed in Singapore by, and is attributable to, Standard Chartered Bank (Singapore) Limited (Registration No. 201224747C/ GST Group Registration No. MR-8500053-0, “SCBSL”). Recipients in Singapore should contact SCBSL in relation to any matters arising from, or in connection with, this document. SCBSL is an indirect wholly owned subsidiary of Standard Chartered Bank and is licensed to conduct banking business in Singapore under the Singapore Banking Act, 1970. Standard Chartered Private Bank is the private banking division of SCBSL. IN RELATION TO ANY SECURITY OR SECURITIES-BASED DERIVATIVES CONTRACT REFERRED TO IN THIS DOCUMENT, THIS DOCUMENT, TOGETHER WITH THE ISSUER DOCUMENTATION, SHALL BE DEEMED AN INFORMATION MEMORANDUM (AS DEFINED IN SECTION 275 OF THE SECURITIES AND FUTURES ACT, 2001 (“SFA”)). THIS DOCUMENT IS INTENDED FOR DISTRIBUTION TO ACCREDITED INVESTORS, AS DEFINED IN SECTION 4A(1)(a) OF THE SFA, OR ON THE BASIS THAT THE SECURITY OR SECURITIES-BASED DERIVATIVES CONTRACT MAY ONLY BE ACQUIRED AT A CONSIDERATION OF NOT LESS THAN S$200,000 (OR ITS EQUIVALENT IN A FOREIGN CURRENCY) FOR EACH TRANSACTION. Further, in relation to any security or securities-based derivatives contract, neither this document nor the Issuer Documentation has been registered as a prospectus with the Monetary Authority of Singapore under the SFA. Accordingly, this document and any other document or material in connection with the offer or sale, or invitation for subscription or purchase, of the product may not be circulated or distributed, nor may the product be offered or sold, or be made the subject of an invitation for subscription or purchase, whether directly or indirectly, to persons other than a relevant person pursuant to section 275(1) of the SFA, or any person pursuant to section 275(1A) of the SFA, and in accordance with the conditions specified in section 275 of the SFA, or pursuant to, and in accordance with the conditions of, any other applicable provision of the SFA. In relation to any collective investment schemes referred to in this document, this document is for general information purposes only and is not an offering document or prospectus (as defined in the SFA). This document is not, nor is it intended to be (i) an offer or solicitation of an offer to buy or sell any capital markets product; or (ii) an advertisement of an offer or intended offer of any capital markets product. Deposit Insurance Scheme: Singapore dollar deposits of non-bank depositors are insured by the Singapore Deposit Insurance Corporation, for up to S$100,000 in aggregate per depositor per Scheme member by law. Foreign currency deposits, dual currency investments, structured deposits and other investment products are not insured. This advertisement has not been reviewed by the Monetary Authority of Singapore. Taiwan: SC Group Entity or Standard Chartered Bank (Taiwan) Limited (“SCB (Taiwan)”) may be involved in the financial instruments contained herein or other related financial instruments. The author of this document may have discussed the information contained herein with other employees or agents of SC or SCB (Taiwan). The author and the above-mentioned employees of SC or SCB (Taiwan) may have taken related actions in respect of the information involved (including communication with customers of SC or SCB (Taiwan) as to the information contained herein). The opinions contained in this document may change, or differ from the opinions of employees of SC or SCB (Taiwan). SC and SCB (Taiwan) will not provide any notice of any changes to or differences between the above-mentioned opinions. This document may cover companies with which SC or SCB (Taiwan) seeks to do business at times and issuers of financial instruments. Therefore, investors should understand that the information contained herein may serve as specific purposes as a result of conflict of interests of SC or SCB (Taiwan). SC, SCB (Taiwan), the employees (including those who have discussions with the author) or customers of SC or SCB (Taiwan) may have an interest in the products, related financial instruments or related derivative financial products contained herein; invest in those products at various prices and on different market conditions; have different or conflicting interests in those products. The potential impacts include market makers’ related activities, such as dealing, investment, acting as agents, or performing financial or consulting services in relation to any of the products referred to in this document. UAE: DIFC – Standard Chartered Bank is incorporated in England with limited liability by Royal Charter 1853 Reference Number ZC18.The Principal Office of the Company is situated in England at 1 Basinghall Avenue, London, EC2V 5DD. Standard Chartered Bank is authorised by the Prudential Regulation Authority and regulated by the Financial Conduct Authority and Prudential Regulation Authority. Standard Chartered Bank, Dubai International Financial Centre having its offices at Dubai International Financial Centre, Building 1, Gate Precinct, P.O. Box 999, Dubai, UAE is a branch of Standard Chartered Bank and is regulated by the Dubai Financial Services Authority (“DFSA”). This document is intended for use only by Professional Clients and is not directed at Retail Clients as defined by the DFSA Rulebook. In the DIFC we are authorised to provide financial services only to clients who qualify as Professional Clients and Market Counterparties and not to Retail Clients. As a Professional Client you will not be given the higher retail client protection and compensation rights and if you use your right to be classified as a Retail Client we will be unable to provide financial services and products to you as we do not hold the required license to undertake such activities. For Islamic transactions, we are acting under the supervision of our Shariah Supervisory Committee. Relevant information on our Shariah Supervisory Committee is currently available on the Standard Chartered Bank website in the Islamic banking section. For residents of the UAE – Standard Chartered Bank UAE does not provide financial analysis or consultation services in or into the UAE within the meaning of UAE Securities and Commodities Authority Decision No. 48/r of 2008 concerning financial consultation and financial analysis. Uganda: Our Investment products and services are distributed by Standard Chartered Bank Uganda Limited, which is licensed by the Capital Markets Authority as an investment adviser. United Kingdom: In the UK, Standard Chartered Bank is authorised by the Prudential Regulation Authority and regulated by the Financial Conduct Authority and Prudential Regulation Authority. This communication has been approved by Standard Chartered Bank for the purposes of Section 21 (2) (b) of the United Kingdom’s Financial Services and Markets Act 2000 (“FSMA”) as amended in 2010 and 2012 only. Standard Chartered Bank (trading as Standard Chartered Private Bank) is also an authorised financial services provider (license number 45747) in terms of the South African Financial Advisory and Intermediary Services Act, 2002. The Materials have not been prepared in accordance with UK legal requirements designed to promote the independence of investment research, and that it is not subject to any prohibition on dealing ahead of the dissemination of investment research. Vietnam: This document is being distributed in Vietnam by, and is attributable to, Standard Chartered Bank (Vietnam) Limited which is mainly regulated by State Bank of Vietnam (SBV). Recipients in Vietnam should contact Standard Chartered Bank (Vietnam) Limited for any queries regarding any content of this document. Zambia: This document is distributed by Standard Chartered Bank Zambia Plc, a company incorporated in Zambia and registered as a commercial bank and licensed by the Bank of Zambia under the Banking and Financial Services Act Chapter 387 of the Laws of Zambia.